Lost in the incessant din of real estate appreciation and slower economic growth is the stark choice faced by retirees; a trade-off between capital preservation or self. Younger generation please pay attention.
One of the conundrums facing policy makers and savers when planning or discussing retirement savings is to determine the quantum of savings i.e. how much of a nest egg will be enough? Since most savers are looking to plan for something distant in the future, neither the path to investing for the unknown, nor the outcome, is well understood. However, a couple of issues are definite:
- Guaranteed replacement income is required for sustenance.
- Given uncertainty of life related events such as emergencies – medical or otherwise – conservatism in planning will serve individuals much better than fate.
In the euphoria / trepidation (for some), surrounding real estate values appreciating in Canada, a very simple fact related to risk-free cost of investing is lost. While those with significant equity and a shortfall in retirement assets could cash out, the risk-free return available on the cash surplus so acquired, has declined significantly in the last 15 years. Assuming a retiring senior downsized to a more manageable dwelling in 2016, and the surplus equity available to that senior to meet retirement income needs is $1 Million, Figure 1 highlights the trend in pre-tax risk-free return available today compared to 10 years and 15 years ago on the 10-year Government of Canada bond.
Figure 1
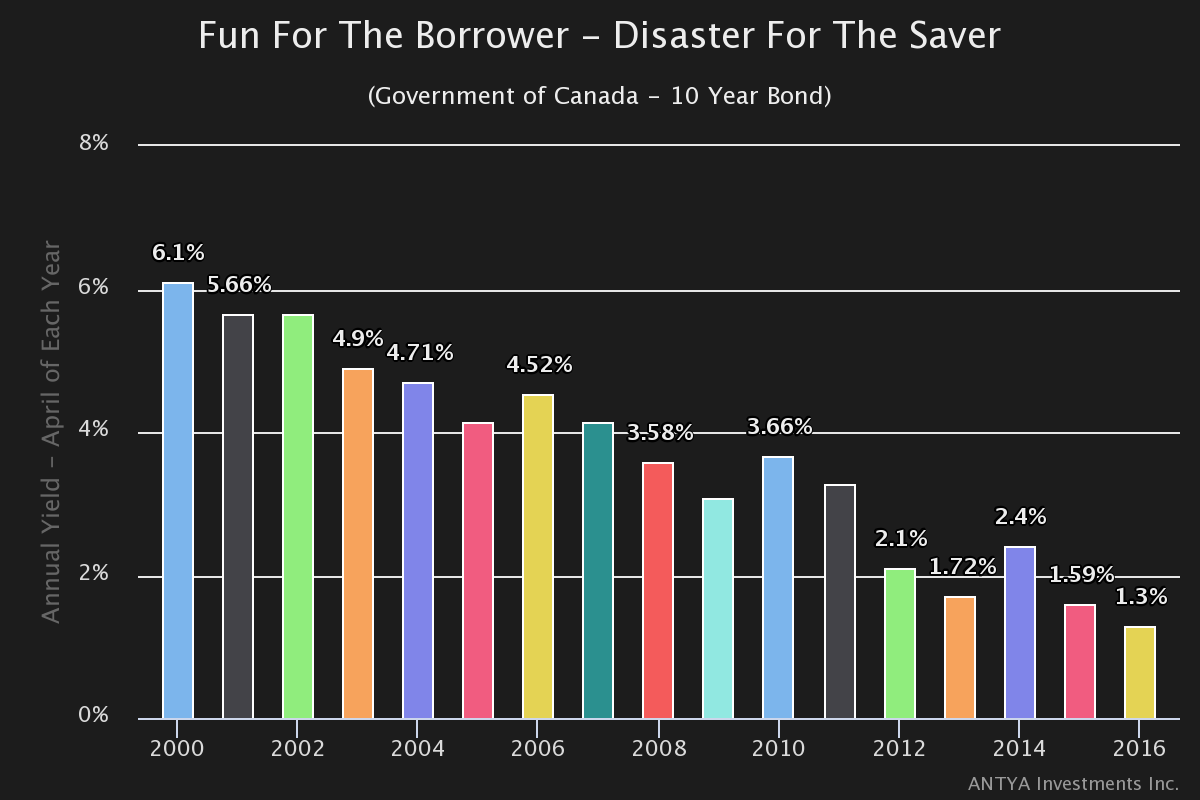
Source: Bank of Canada & ANTYA Investments Inc.
Although central bankers claim to be working to benefit the populace in large, it appears the unintended consequences for savers and retirees are far worse than envisioned by policy makers. Our hypothetical retiree would earn $13,000 annualized on his/her $1 Million nest egg today, compared to his/her compatriot’s earnings of $61,000 per year in April 2000 on a similar sum. Figure 2 highlights the significant decline in income for such an individual.
Figure 2
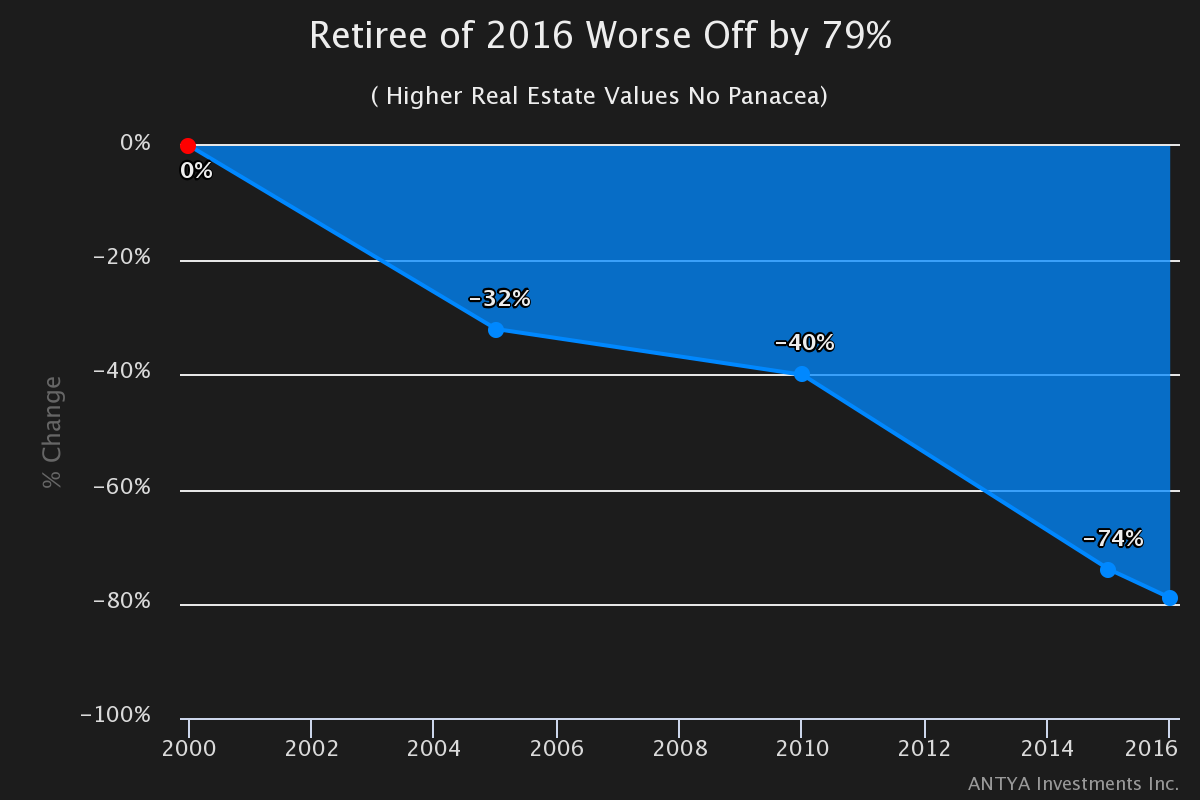
Figure 2 highlights the incessant erosion in the returns available to an income investor beginning 2000. A 79% decline in the income generation capability of a $1 Million retirement fund ( as of April 2016 ) is no laughing matter either for those already retired, or those looking to save for retirement. In other words today’s retiree would need $4.69 Million in accumulated liquid assets to earn a risk-free rate of return similar to what his/her predecessor could earn with $1 Million in April 2000.
Moreover, nominal comparison of income can be misleading because the basket of goods and services that could be bought with a dollar in 2000 is 35% smaller now. Therefore, in real terms a saver today would require $93,846 to be even with an income of $61,000 in 2000. That implies a requirement of $7.2 Million dollars in today’s dollars to stay even with someone with $1 Million in 2000. (These calculations are based on Bank of Canada’s inflation calculator). Shocking but True !
Clearly, no planner that created a financial plan in 2000, foresaw the decline in rates to almost zero, and hence many financial plans are likely to be behind the curve in delivering the goods for investors.
To recap, prospective returns are indeterminate and unforeseeable, while cash required to meet expenses is certain and will increase over time due to rising life expectancy which according to a report from the Office of the Superintendent of Financial Institutions, is forecast to increase to 90 years.
Lower Costs Matter
In ANTYA’s view a diversified allocation to varying asset classes, while keeping trading and management costs low is very important for savers to meet some of their goals. Returns based on forecasts can be far from the mark, while investment management costs, just like death and taxes are certain. As illustrated in Figure 3, ceteris paribus, the ANTYA 20/20 Growth Portfolio will increase an investor’s wealth by more than 35% over a 20 year period courtesy lower costs.
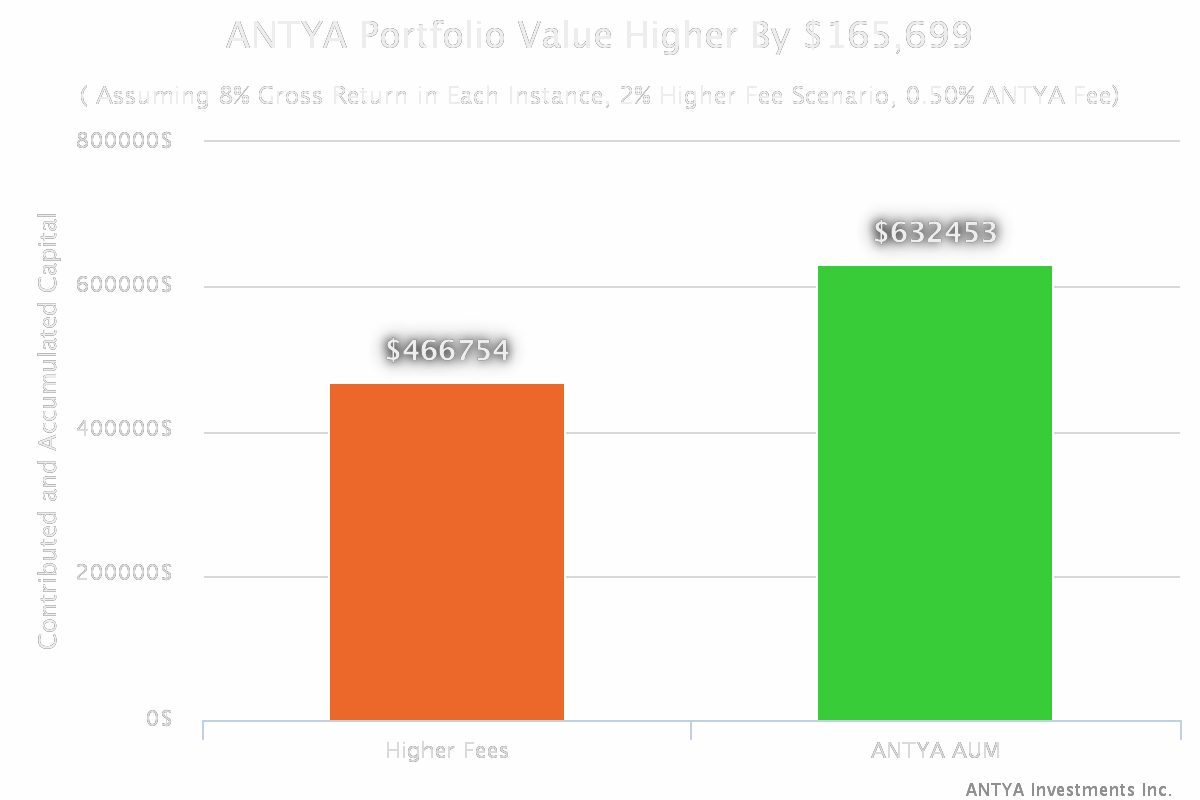
The magic of lower costs is highlighted by the increase in portfolio value at ANTYA by $165,699, compared to higher cost competing offerings, which is greater than total initial contributed capital of $150,000 . Assuming an investor’s lifestyle expectations after retirement are set, in the lower fee scenario, ANTYA’s investors will have a 35% longer runaway with the same amount of capital. More importantly, with life expectancy set to increase by 10%, from 82 years to 90 years, the extra 35% could be the difference between staying fully funded or face a significant shortfall risk. In addition, with inflation expected to do what it normally does, lower costs are the need of the hour.
Conclusion
There will be umpteen explanations for returns missing expectations. Nonetheless there is little justification for bearing the costs associated with active management, when history has shown that a majority of active managers fails to outperform their benchmarks. Moreover, it is impossible to pick winners on a prospective basis. Therefore, our lower costs provide one half of the solution, while our Astute Asset Allocation algorithm provides the other.
We advocate and embrace simpler products, lower costs and transparent portfolios.