Although advice given by stock market experts on TV is well-meaning and sincere, randomly created portfolios from top-picks of TV experts, fail to outperform the S&P/TSX 60 total return index. We conclude ANTYA’s low-cost asset allocation service is a much better option.
Download this Report
Over the last decade, a Canadian business news channel has developed business programming dedicated to hosting stock-market experts on a daily phone-in show. Viewers from across Canada seeking investment counsel, call in seeking expert advice. There is the added possibility of getting some hot investment tips either from other viewers asking questions, or the top 3 stock picks provided by the guest expert at the end of the show. While it makes for good interactive TV, does any of it make for sound investing?
That was the question ANTYA set out to answer, and our limited (in terms of time period chosen) yet rigourous quantitative analysis suggests that viewer time is better served doing errands, community service, or pursuing a hobby that interests them.
Our analysis shows that based on portfolio performance, equity market experts publicising their best investment ideas on TV significantly underperformed the TSX 60, while clearly failing to fulfill three cardinal principles of stock picking.
- Top picks should preserve capital in a declining market
- Top picks should outperform in rising markets and in declining markets; and
- Top picks should be less volatile than the overall market.
Moreover, any portfolio comprising top picks of stock market experts should perform better than the overall stock market, and if not, at least in line with the stock market index (the TSX 60 total return index in our study). Based on our analysis we find that randomly created portfolios of Canadian stocks based on top picks of guest experts were unsuccessful on all three fronts.
Our Methodology
Our data collection efforts concentrated on the months of May, June and July 2014. We ultimately decided to focus on June 2014, since it gave us the ability to conduct analysis for a period of 18 months ended December 2015. All our total return data was gathered from Morningstar Advisor database. The experts picked 55 Canadian (4 Canadian stocks were discarded due to unavailability of data in Morningstar) and 31 U.S. stocks during the month of June 2014. Our analysis accounts for Canadian stock picks only.
In order to avoid any bias in stock picking, using Excel’s random number generator, we created 5 random equally weighted portfolios comprising 30 stocks each (named 30.1, 30.2, 30.3, 30.4 and 30.5), and one equally weighted portfolio consisting of all 55 stocks picked in June 2014 (named Total Portfolio)[i]. All stocks are held in the portfolio for the entire 18-month period. Our analysis excludes any transaction costs that would be incurred in creating the portfolio or any management fees that would be charged to the portfolio. We benchmarked the 18-month performance of these portfolios against the TSX 60 total return index (“TSX 60”).
Beware Investors – Caution is Recommended
Figure 1 highlights the significant under-performance of each of the Top 30 portfolios, and the Total Portfolio, compared to the TSX 60 for the eighteen-month time-period from July 01.2014 to December 31.2015.
Figure 1
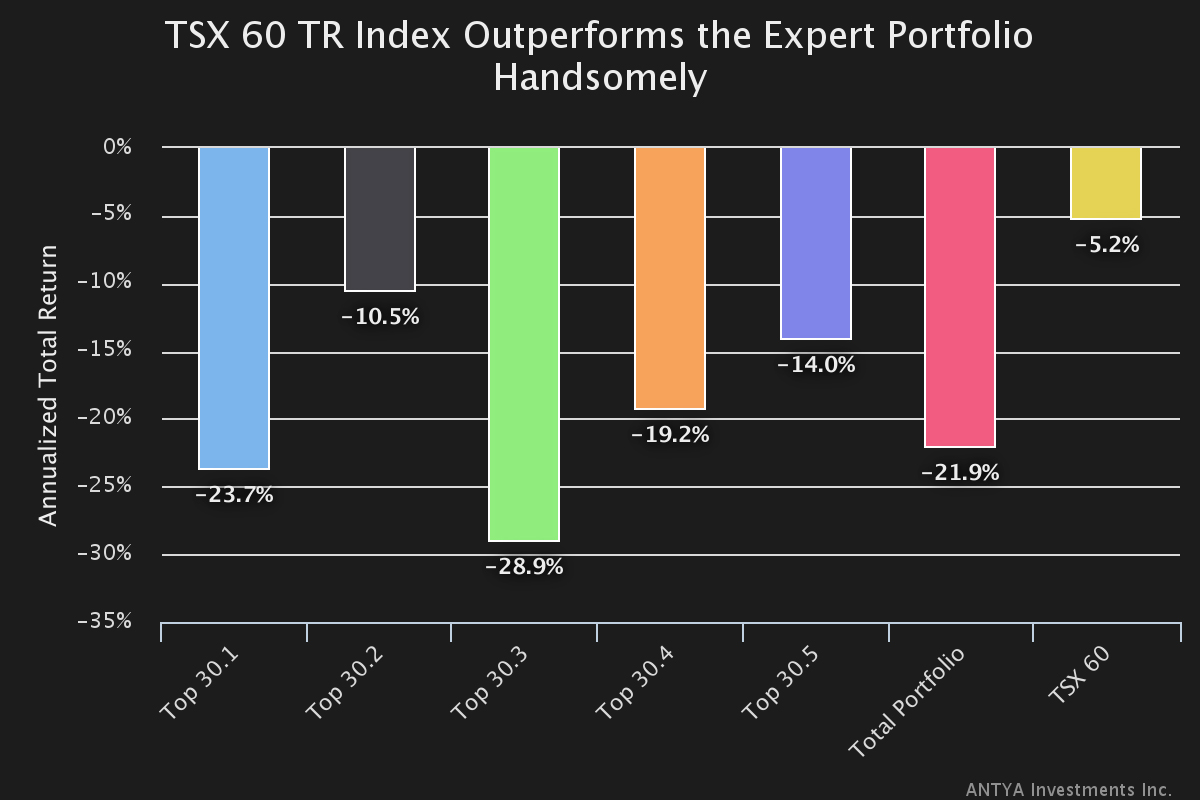
As illustrated, none of the randomly generated portfolios of Figure 1, or the Total portfolio, did any credit to the Top Picks moniker of the TV show. All portfolios under-performed TSX 60 significantly. Not only did the portfolios under-perform, they did so in style with annualized standard deviation of returns of each of the portfolios far exceeding that of the TSX 60 as illustrated in Figure 2.
Figure 2
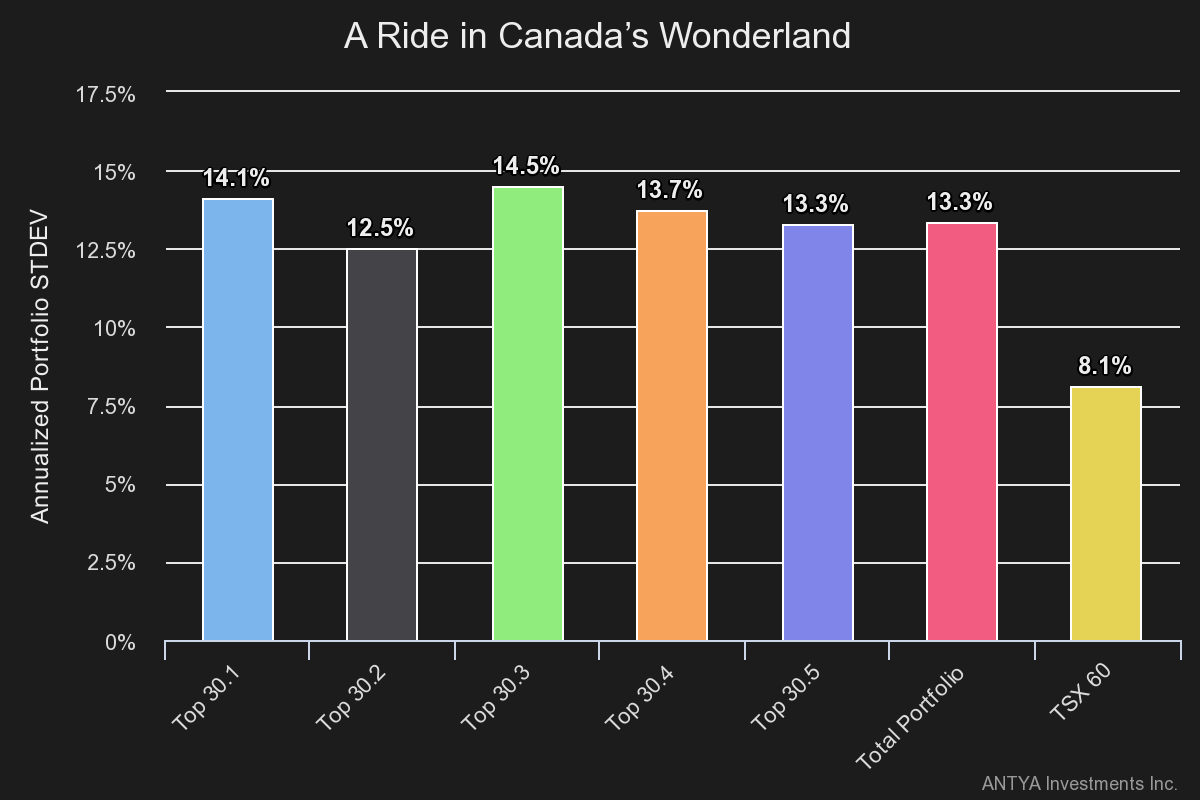
While the TSX exhibited annualized standard deviation of returns of 8.1% between July 2014 and December 2015, the minimum volatility exhibited by the Top Pick portfolio 30.2 was 12.5%. Other portfolios including the Total Portfolio delivered a much higher standard deviation of returns. If nothing else, one would then hope that at least these fundamentally researched Top Picks would preserve capital in a down market as measured by portfolio drawdown?
Figure 3 highlights the capital preservation ability or inability as some might call it, of the Top Picks portfolios.
Figure 3
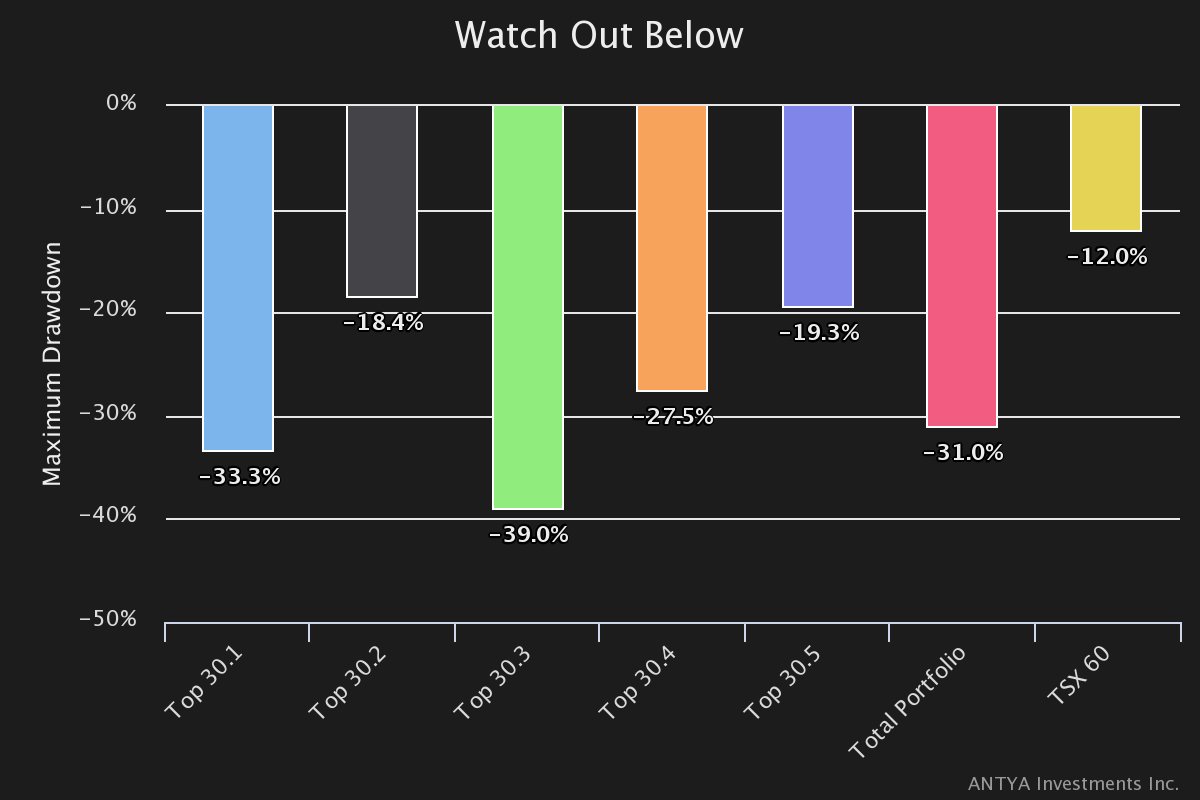
Needless to say that all portfolios violate the first cardinal principle of investing – capital preservation in down markets – highlighted at the beginning of the report. While the TSX had a max-drawdown i.e. a maximum decline from peak to trough of -12%, the top-pick portfolios show drawdowns ranging from -18% to -39%.
Percentages and analysis are fine to an extent, but ultimately an investor would want to look at the cash in the account and decide what to do next? In this instance the investor would run for cover.
Figure 4
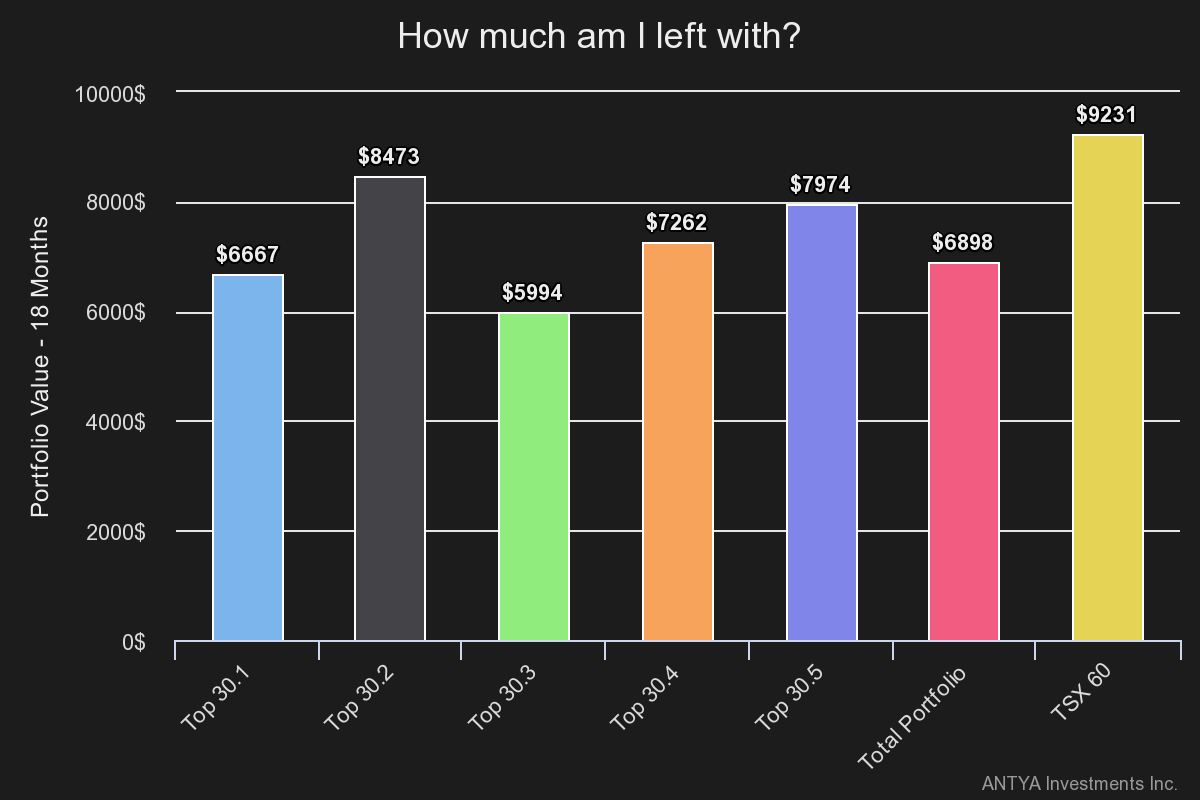
If a hypothetical investor had invested $10,000 on July 1, 2014, in one of the Top Pick portfolios, in a best case outcome that investor would have $8,473 on December 30, 2015, and only $5,994 in a worst case. In either instance, TSX 60 has handily beaten all portfolios by being less volatile, by preserving capital better, and providing the best return.
Needless to say that results of all portfolios would be much worse if transaction costs and investment management fees of 2% or more were deducted from these portfolios. Investors bear those costs irrespective of portfolio performance.
Is our word final?
Clearly results outlined by us should not be taken as representing the investing prowess of all TV or non-TV personalities. Investing outcomes are predicated upon the timing of investment, as much as, on the quality of investment itself. Many would argue that our hypothetical portfolio held stocks for the entire duration of the study irrespective of news flow, whereas active managers would have churned the stocks given changing conditions. While we agree with that sentiment, in or view, any stock portfolio that needs to be churned based on news flow, is not an investing portfolio but merely a random basket of stocks held for quick trading flips. These stock picks are clearly called Top Picks. If Top Picks change on a dime, then we have to question the underlying process of stock picking and investing prowess of the expert.
Another criticism of our methodology could be that one should not randomly create portfolios based on recommendations from experts with differing viewpoints, time-horizons and investing styles, because each expert caters to a unique clientèle and therefore benchmarks his/her performance differently. Although a reasonable view, we believe creating a diversified portfolio involves all stakeholders in the equity markets and hence collective, equally weighted, unbiased and randomly generated portfolios should do at least as well as the overall market if not better.
Some might say that to conduct an analysis on the basis of one month of recommendations fixed for eighteen months is too short a time frame to draw meaningful/defensible conclusions. That would be true, except that but based on studies from SPIVA, it wouldn’t hold much water[ii].
To conclude – What should Investors Do?
Well meaning, hardworking and smart investing professionals are at work every day to understand the nuances of human psychology, and match that with a quantitatively rigourous, unemotional, and yet uncertain task of identifying good investment opportunities. But it is just too darned hard to beat the market. At this juncture I recall a quote from an institutional investment meeting on Bay Street where a top money manager said, “I have seen guys with conviction in the top quartile and in the bottom quartile. Our job is to stay within the middle band”. In other words, managers are trying to create a path of least resistance by staying close to the benchmark index.
Our other research reports have already discussed Index Hugging in detail. Recently, the Ontario Securities Commission has asked many active managers for data outlining their holdings and investment process to understand the active management strategies of these organisations.
Thus our conclusion is that investors should not pay premium prices for plain vanilla products. Lower costs will go a long way towards enhancing returns and providing a financial cushion for hard times and for your retirement dollars. Our lower fees can boost your wealth by over 25% in 10 years.
[i] See VITARKA of February 2016 – Asset Allocation Holds Fort
[ii] How Many Stocks Make a Diversified Portfolio, Journal of Financial and Quantitative Analysis, Volume 22, No. 3, September 1987
Download this Report