Since October 2017, we have held the view that interest rates in the U.S. are headed higher further and faster than anticipated or forecast by market participants currently. The latest FOMC release bolsters are outlook and barring any trade-related disruptions or disputes; we believe that the Fed is on track for four rate hikes this year and four in 2019.
Consistent with our view that the U.S. economy is firing on all cylinders and that the FOMC has its task cut out, the Federal Open Markets Committee (“FOMC”) release of March 21, 2018, was more hawkish than capital markets participants have been expecting. Although Jerome H. Powell (“Powell”), the new Chairman of The Federal Reserve (“The Fed”) was measured in his answers at the post-meeting press conference, we take comfort in the fact that Powell and the FOMC highlighted a couple of issues that bolster our position and require further discussion.
- At the September 20, 2017 meeting the FOMC median unemployment rate expectation for 2020 was 4.2%. That has been lowered to 3.6% in the latest release. This development is especially positive for the U.S. economy, because Powell also highlighted a stable Labour Force Participation rate (“LPFR”) as part of his prepared remarks prior to the press conference. Researchers from The Fed believe, that a decline in LFPR since the recession can be explained by aging demographics, and hence in ANTYA’s opinion, any stability in a secularly declining LFPR speaks to a very strong labour market. As discussed in our previous report the LFPR went up 30bps in February 2018, suggesting a much stronger job market than evident on the surface February 2018 Employment Report – Supports 4 Hikes in 2018 and 4 in 2019_ Are Asian Equities Ready?.
- FOMC participants have revised forward-looking GDP growth estimates upwards in a meaningful way, thereby suggesting that the data dependent monetary policy doves are also catching on to the strength in the underlying economy. Once again, in comparison to the September 2017 release, for each of 2018, 2019 and 2020 the GDP growth forecasts have been revised upwards to 2.7%, 2.4%, and 2.0% from 2.4%, 2.1% and 2.0% respectively.
Federal Funds Rate Projections Gaining Altitude
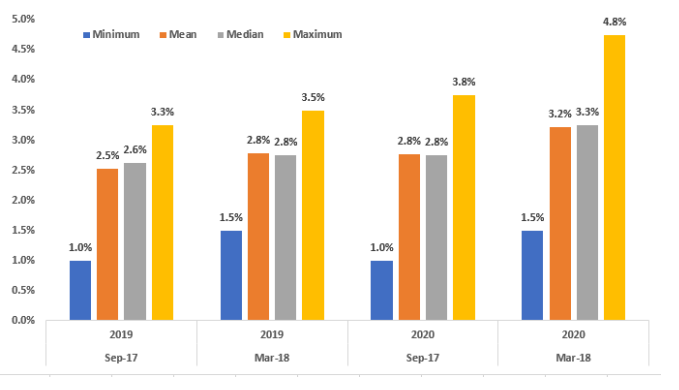
The latest forecast from the FOMC is reflective of a more belligerent stance from The Fed in indicating its intentions to the broader market. As illustrated in Figure 1, in the last six-months the 2020 fed-fund rate spreads have widened out quite a bit, while those that stuck to the middle have moved on collectively to higher grounds.
Source: FOMC and ANTYA Investments Inc.
Figure 1 presents a comparison between FOMC projections for the federal funds rate and changes thereon since September 20, 2017, and March 21, 2018. It is evident from Figure | that both at the short-end of the curve and the long-end of the curve there is considerable room for opinion to converge towards a more sombre view of a neutral funds rate as opposed to an accomodative stance. For example, while in September 2017 at least one committee member expected a 1% rate for 2019, in March 2018, the minimum expectation is 1.5%. To put it in context we are already at 1.75% for 2018. Hence forecasts are bound to change, and there will be further revisions upwards. At the far end of the curve, i.e. in 2020, the spread between the maximum rate of 4.8% and the median rate of 3.5% is significantly higher at 1.5%, compared to 1% forecast just six months ago.
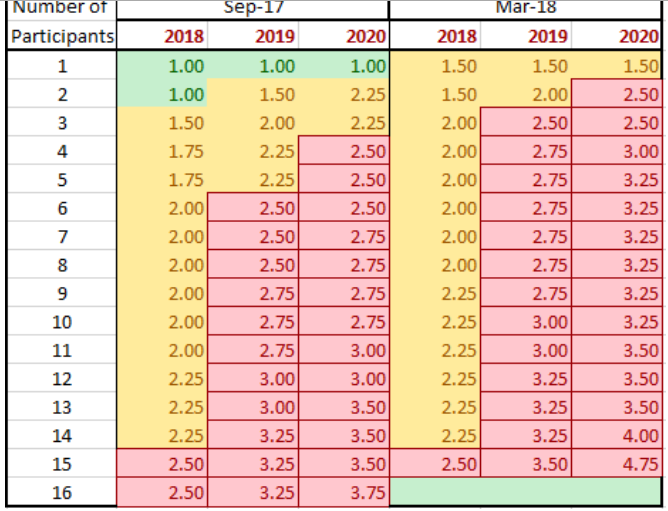
These developments suggest that the FOMC is still wrestling internally with remnants of the bust and doesn’t want to telegraph that it is about to raise borrowing costs too soon. Nonetheless, Figure 2 provides a coloured view of FOMC’s internal deliberations and in our opinion, suggests clustering towards higher rates than some market participants believe are forthcoming.
Source: FOMC and ANTYA Investments Inc.
Figure 2 highlights the transition and movement within the FOMC towards higher rates for 2019 and 2020. Yellow cells highlight rate expectation between 1.00 and 2.25 percent as expressed by FOMC participants in September 2017 and March 2018. Clearly, given the backwards-looking nature of monetary policy, the rate-setting process is bound to play catch up to better news. Between September and March, red cells, i.e. a fed-funds rate higher than 2.25% increased in number, accompanied with a more elevated fed-funds rate on average. As shown in Figure 2 the spread between the highest rate expectation stands at 50bps for the September 2017 forecast (highest of 2020 less highest of2019), compared to 1.25% for the 2018 outlook. (For March 2018, one committee member did not submit a prediction)
Jobs Moving Ahead of Committee Estimates
While the FOMC goes about managing its business, the U.S. employment market shows no sign of slack. Data from Bureau of Labor Statistics (“BLS”) highlighted in Figure 3, outlines that at current levels of 1.1 unemployed for each job opening, the U.S. labour market has recovered both its slack and its strength.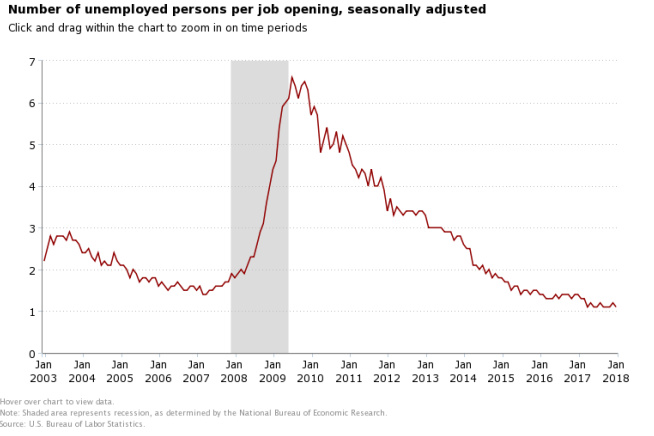
The Conundrum of Wage Inflation
Wage inflation is a tricky subject, especially in a service-based economy that is undergoing secular declines in LFPR and_ structural changes with manufacturing and high-value software development being off-shored. With a significant proportion of the services-based economy involved directly in
software development , offshoring to India and other parts of the world has played a role in limiting wage increases in that segment, benefiting both users and developers of technology. With new restrictions being imposed on high- tech labour mobility by the Trump administration, and with the less-skilled and young no longer available readily for other service sector jobs, wage inflation in
the services sector is bound to rise in coming months.
Conclusion
We maintain our view that with opinions on the FOMC beginning to show wider dispersion than in the past, and the U.S. economy entering a phase of considerable labour market tightness unless LFPR improves with each passing quarter, volatility is bound to increase in markets. With a 3.5%-4% one-year risk-free rate in the offing within twelve to eighteen months, steady dividend yield stocks, utility stocks and low-growth companies are headed for a rough time.
Emerging market equity spreads are also likely to widen accompanied with compressing P/Es and increasing dividend yields. Caution, conservative portfolio construction, and a bet on the right growth stocks will carry the day.