ANTYA’s benchmark allocation to Canadian equities is 20%. Given global economic and political uncertainty, negative yields on approximately $10 trillion of global debt securities, expected benefits to Canada of Brexit, and in our view the relative undervaluation of TSX 60 vis-à-vis the HPI, we ….. ANTYA reminds Canadians that a faltering residential property market will have wide ranging repercussions, including lower prospective total returns for all asset classes in Canada.
Download this Report
Real estate has occupied public consciousness in Canada during the 2nd and 3rd quarter of 2016. It all started with The Globe and Mail publishing an investigative story on suspect property transactions in British Columbia in April 2016, followed by extraordinarily bullish data on house price growth in Toronto and Vancouver. Both the Multiple Listing Service House Price Index (“HPI”), and Teranet House Price Index (“THPI”) are breaking monthly records.
The Bank of Canada (“BOC”) waded into the debate through the Financial System Review (“FSR”) in June 2016. The FSR published results from a study outlining negative equity position of the outstanding stock of mortgages if house prices suffered a decline ranging from 15%-25%. 600,000 HH and $280 billion in mortgage debt would be in a negative equity position if the scenarios modeled by its economists as outlined in the FSR were to play out.
Not to be left behind Canadian Mortgage Housing Corporation (“CMHC”) has been raising its rhetoric recently, with guarantee fees on government-sponsored mortgage securitizations increasing on 1 July 2016.
The Office of the Superintendent of Financial Institutions (“OSFI”) has asked Canadian banks to stress test for a 50% house price drop in Vancouver, a 40% decline in Toronto and 30% elsewhere in Canada. In addition, new requirements on modified capital requirements for federally regulated lenders will take effect on 1 November 2016.
To top it all, the provincial government of British Columbia has announced a blanket 15% purchase tax to be paid by foreigners when buying property in Vancouver. The measure intended to prevent speculative activity in the marketplace is already having its intended cooling effect. Debate on the efficacy of introducing a special vacancy tax on unoccupied dwellings in the city of Vancouver is also underway. Next in line of fire – Toronto?
How High are Canadian Property Prices?
In order to provide a context to Canadian house price appreciation, in Figure 1 we benchmark Canada to its G7 peers. As illustrated in Figure 1, house price appreciation and per capita GDP growth are mostly in sync, except in Japan and Italy. The economic problems of Italy and Japan are too well known to discuss here
Figure 1 – Annualised Home Price Growth, 2000-2015
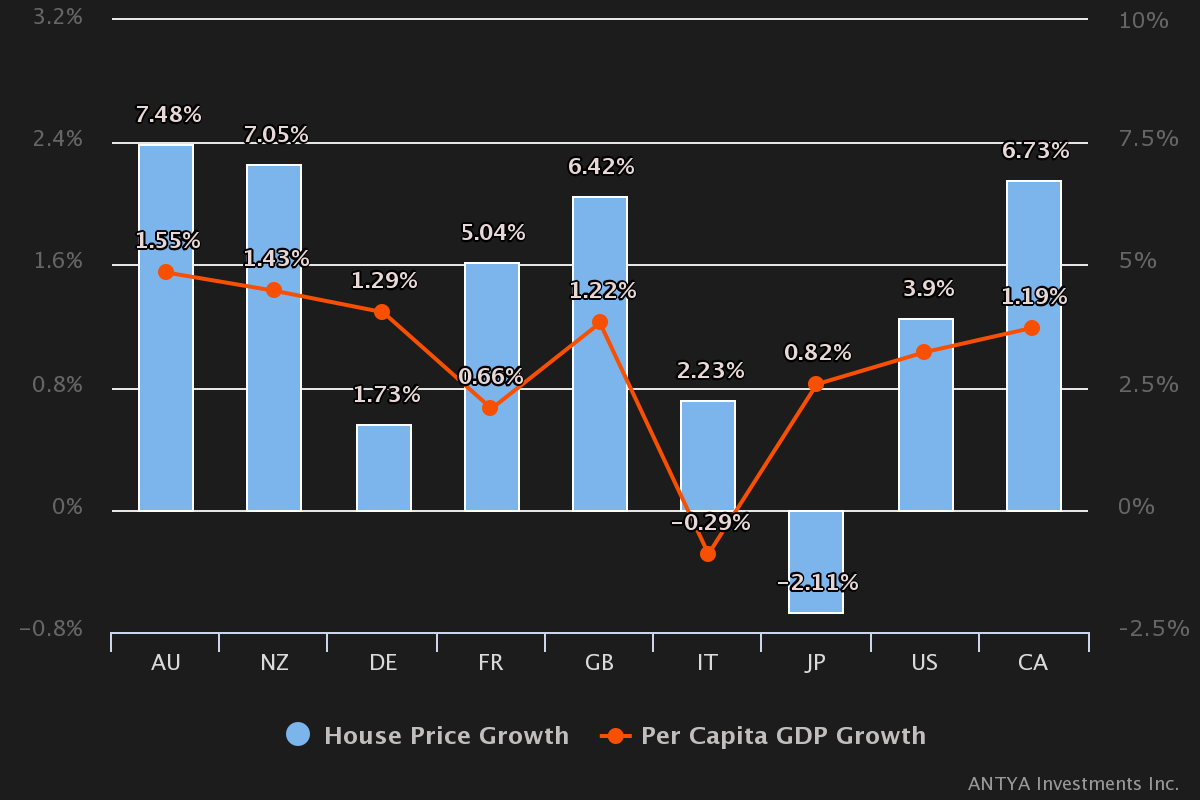
Source: ANTYA Investments Inc. and Bank of International Settlements
Remarkably, Australia (“AU”), New Zealand (“NZ”), Canada (“CA”) and Great Britain (“GB”) have all benefitted from the rise of China, and the concomitant spike in commodity prices.
However, the consensus view is that due to:
- A Chinese slowdown
- British exit from the EU
- Japanese monetary stimulus cascading through global financial markets in the form of negative interest rates
- A moribund Fed; and
- Turkey along with large parts of North Africa and the Middle East in turmoil, ownership of real estate in a stable and law-abiding jurisdiction is a safe haven trade.
Low Rates Explain Almost Everything
In other words, Canadian real estate offers nirvana to the displaced, the dispossessed and perhaps the judicious capital allocator. This viewpoint while valid, and more recently substantiated with some data on capital flight from China finding a home in B.C., ignores the impact of declining interest rates on property values across Canada, and much of G7.
Figure 2: Canada 5-year Bond Yield vs. MLS Aggregate HPI: Jan 05 – June 16
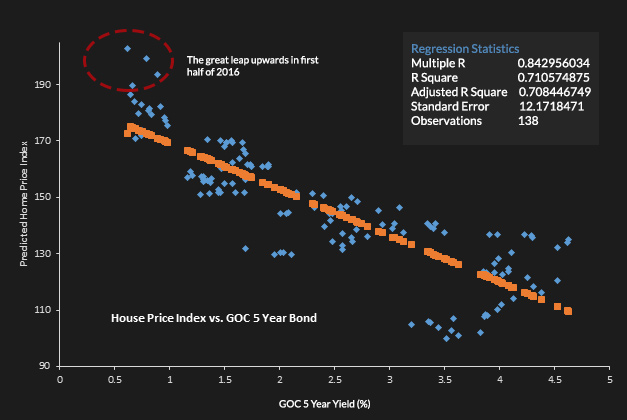
Source: ANTYA Investments Inc.
As illustrated in Figure 2, declining Government of Canada (“GOC”) bond yields explain 71% of the appreciation in HPI in Canada. Clearly growing per capita GDP, growing population density of metropolitan areas, and lastly foreign capital inflows into Canadian real estate are additional contributing factors.
Still, the recent deviation from trend outlined in Figure 2 – with HPI leaping above predicted values (highlighted in the red oval) -appears to have caused significant consternation in the corridors of power, resulting in a flurry of recommendations and/or diktats by regulators, policy-makers, and politicians.
In ANTYA’s view, by taxing foreign purchasers, political masters in B.C. are tackling a small and insignificant component of the big picture. Nonetheless, it is likely that speculation promoted by unprincipled real estate agents, has introduced distortions in certain micro-markets in the GTA and Vancouver, and therefore politicians need to be seen acting in broader public interest.
We Have Peaked
In ANTYA’s view the Canadian real estate bull has run out of steam, and going forward real prices will decline while nominal prices will stagnate.Figure 3 illustrates our thinking.
Figure 3 – Rates and Purchasing Power – Higher HPI via Lower Rates
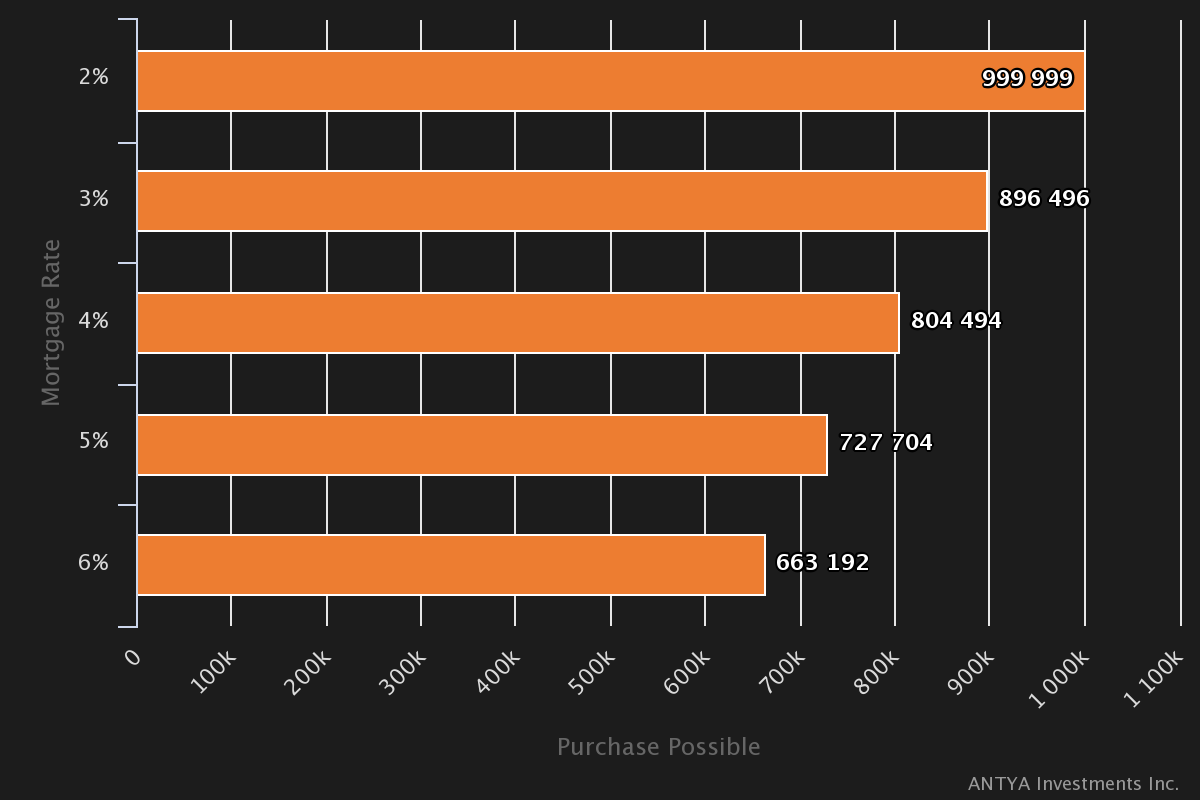
Source: ANTYA Investments Inc., CIBC Mortgage Calculator. Assumptions – $150/month heating costs, $500/month property taxes, $150,000 pre-tax income, $100,000 down payment.
As illustrated, ceteris paribus, the ability to shoulder a bigger mortgage has been engineered by lower debt servicing costs. Given that declining mortgage rates assisted buyers in gorging on so-called “dream properties/neighbourhoods”, a reversal of rates over the next five to ten years will similarly ordain truncated purchasing power.
As illustrated in Figure 3, declining rates contributed to a 50% increase in purchasing power from $663K to $999K without any increase in income. With 5-Year GOC yielding below 0.70%, compared to inflation approaching 2% p.a., lower rates are unlikely to assist in any additional great leap upwards for the HPI.
ANTYA’s intention is not to predict interest rate moves in this report. We just want to highlight that a 2% move over the next 5 years i.e. back to 4% from 2% involving an increase of 40 bps per year, will reduce a purchasing power by approximately 20% under conditions outlined in Figure 3.
No Room to Lower Rates Further
Historically rates moved lower because they could. There isn’t room between today’s 5 year GOC yield and the lower zero bound. Furthermore, the banks have to retain a lending spread to maintain adequate profitability meaning, either Canadian incomes have to start rising ASAP to enable even bigger mortgages, or enough foreign capital has to flow in at the margin to support pricing.
We estimate that mortgage lending spread has averaged 2.5% from January 2005 to December 2015. Therefore, unless banks give up lending margin, which appears unlikely, mortgage rates won’t be heading any lower.
In our view, with foreigners sent a clear signal by B.C., and federally regulated financial institutions under scrutiny by regulators, it is rising incomes and employment that will have to propel property markets upwards. With Canada’s current economic challenges well-documented, we surmise that the road ahead for Canadian real estate is slippery at best.
Our Base Case
ANTYA’s base case for Canada is thus nominally flat home prices nationwide with modest corrections in Vancouver and Toronto. Given Alberta’s exposure to Oil & Gas, the correction there could be severe. More importantly, neither stagnation nor a correction bode well for household finances prospectively, especially given interest rates are expected to be higher 5 years from now.
TSX 60 – Relative to the HPI
At this juncture, to formulate our view on prospective capital allocation, we decided to benchmark unlevered real estate returns calculated based on HPI to S&P/TSX 60 TR Index (“TSX 60”) beginning January 2005.
Figure 4: MLS Home Price Index vs. S&P/TSX 60 TR Index
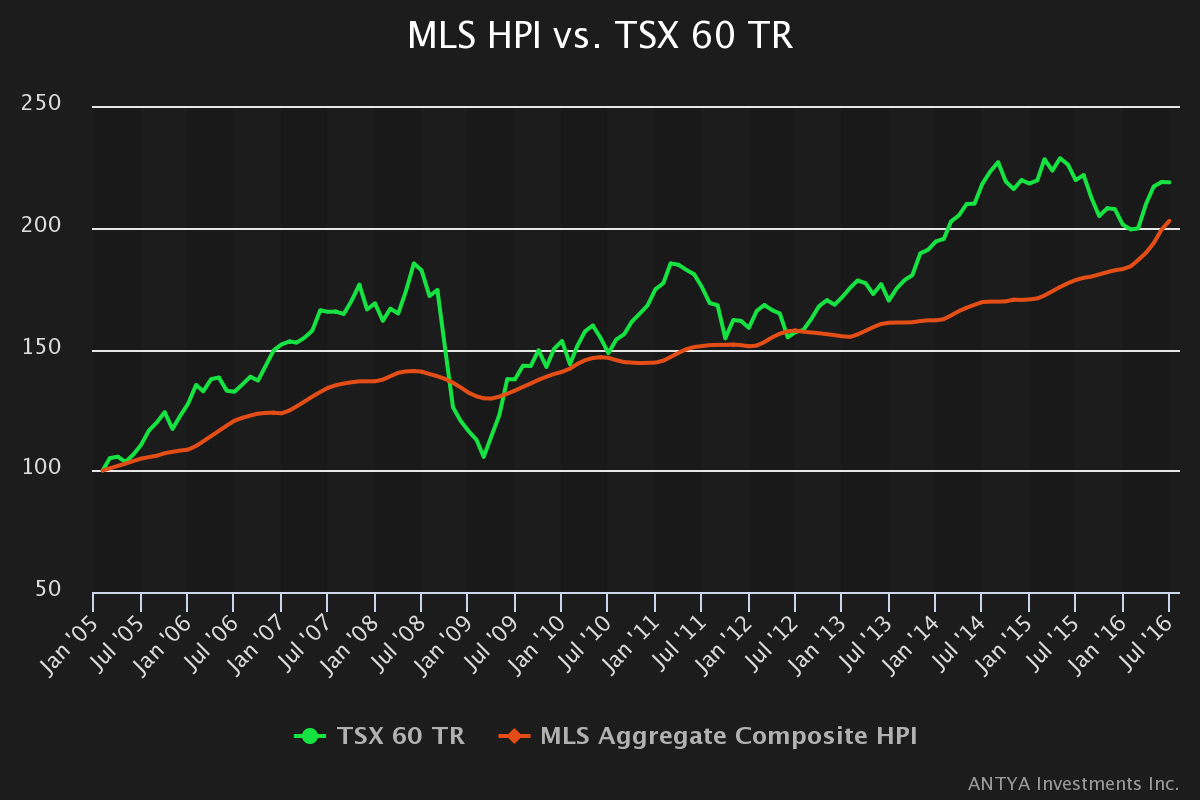
Source: ANTYA Investments Inc., MLS, Morningstar
As illustrated in Figure 4, TSX 60 is up 2.18x beginning January 2005, whereas the HPI is up 2.02x. However, the beauty of investing in real estate is the ability to benefit from leverage, and since a rising tide lifts all boats, real estate owners unwittingly captured upside, and reaped the bounty of low-cost debt with equity positions rising remarkably nationwide. However, as the tide ebbs, the reverse could be much more painful.
Figure 5 provides additional context on a relative basis between Canadian large cap equities and HPI. Beginning 1 January 2005 as the base, TSX 60 has historically averaged 1.14x the HPI. Currently, it is trading below at 1.08x. The range is 0.80x -1.40x. The low was established during the great recession of 08-09, and the high points represent market euphoria.
Figure 5: TSX 60 TR – Multiple of MLS Composite for Canada – Average 1.14
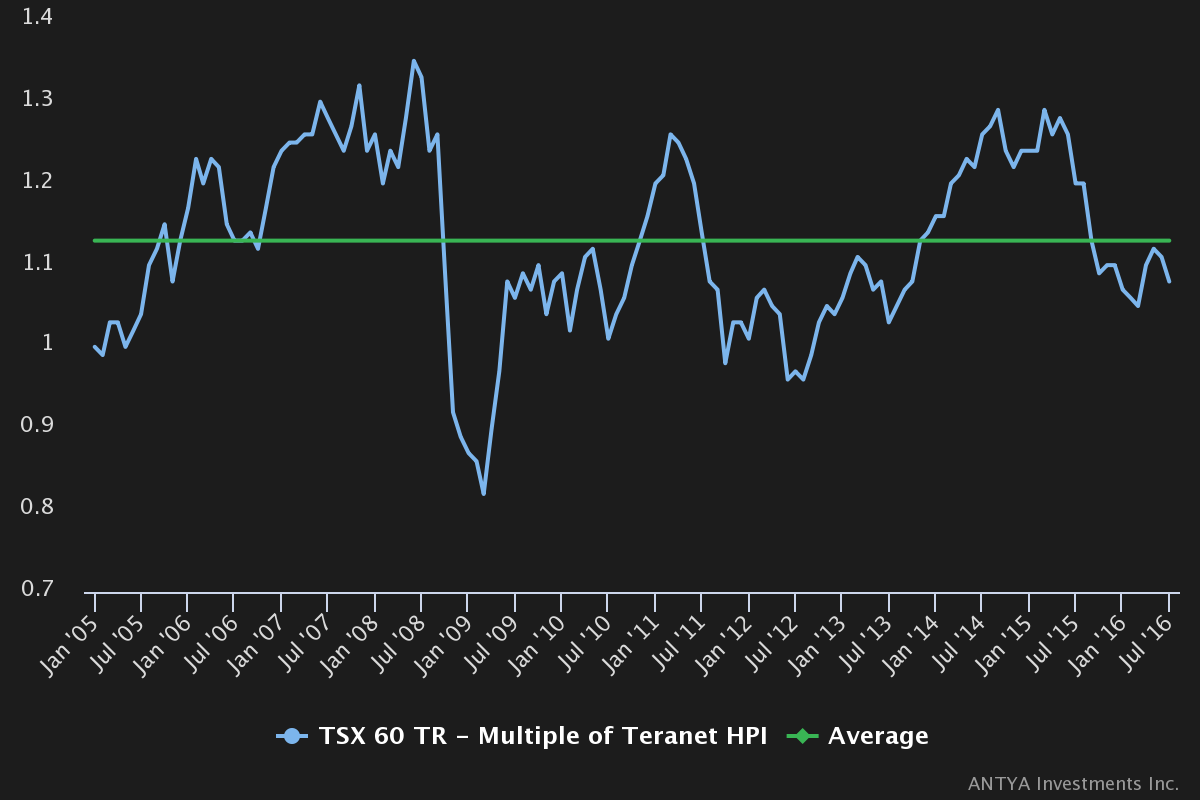
Source: ANTYA Investments Inc., MLS
At its current levels, Figure 5 suggests that TSX 60 is positioned to outperform the HPI, over the next 12-18 months. The contra argument is that TSX 60 is fairly valued, whereas the HPI has run up too much. Either way, in our view it is time to increase exposure to TSX 60 while reducing allocation to real estate in individual portfolios.
We are not advocating a reduction to well-managed REITS, only private properties. REIT managements have growing cash flows that can add value via development, whereas individual investment in condominium and other such property will be an underperforming asset class going forward.
Conclusion
ANTYA’s benchmark allocation to Canadian equities is 20%. Given global economic and political uncertainty, negative yields on approximately $10 trillion of global debt securities, expected benefits to Canada of Brexit, and in our view the relative undervaluation of TSX 60 vis-à-vis the HPI, we have increased our allocation to Canadian equities to 30%.
ANTYA reminds Canadians that a faltering residential property market will have wide-ranging repercussions including lower prospective total returns for all asset classes in Canada.
To discuss your unique wealth management needs, or to get a second opinion, please do not hesitate to contact us.
Download this Report