
First Republic Bank (“FRC”, or the “Bank), with a current market capitalization of $4.2B, is still standing with conflicting opinions as to its viability. Although The Federal Reserve (“The Fed”), the U.S. Treasury, and a consortium of the largest U.S. banks agreed to provide deposit support of $30B for 120 days to FRC, the stock closed 32.8% lower for the day at $23.03. It declined an additional 15% after-market hours[1]. Last month, February 07, 2023, the Bank issued 2.875 million shares of common stock at approximately $143.69/share for net proceeds of $397M[2].
We do not believe that the so-called deposit lifeline changes the underlying economic reality of the Bank. Although FRC reported book equity of $75.38/share for 2022, we estimate it is effectively insolvent. Although the deposit lifeline extended by U.S. financial institutions is a confidence-boosting measure, many of these institutions could suffer a yet undeterminable loss on these deposits. Figure 1 highlights our thinking.
Figure 1 – Fair Market Value of Assets and Liabilities at FRC
| Main Assets | 2022 | Source | ||
| Book Value | Fair Value | Deficit | 2022 10-K Filing | |
| HTM Securities | $28,359 | $23,587 | -$4,772 | Note 3 – Page 143 |
| AFS Securities | $3,347 | $3,347 | $0 | |
| Real Estate Loans | $136,793 | $117,520 | -$19,273 | Note 15 – Fair Value of Financial Instruments – Page 180 |
| Other Loans | $29,291 | $26,405 | -$2,886 | Note 15 – Fair Value of Financial Instruments – Page 180 |
| Total | $197,790 | $170,859 | -$26,931 | |
| Common and Preferred Stock | A | $17,446 | Page 127, 10K | |
| Total Debt on Books | B | $16,831 | FactSet | |
| Total Capital | C | $34,277 | Common Stock + Preferred Stock + Debt | |
| Net Economic/Solvency Surplus | D | $7,346 | Total Capital – Deficit | |
| Fully Diluted Shares Outstanding (M) | 187.3 | FactSet | ||
| Loss on Equity | 100% | A less Deficit | ||
| Loss on Bonds | -56% | 100% -(D/B) | ||
| Book Value on a Solvency Basis | $0.00 | |||
Source: ANTYA Investments Inc. & Company Filings
The deposits provided by the consortium will displace deposits that are fleeing or being repriced. The $30B provided by the consortium will likely cost somewhere between 4%-5%, and although it is meant for 120 days, if it stays for a year, the Bank will have to pay $1.2B, at a minimum, to keep these deposits. FRC reported interest expenses of $888M for all of 2022 on its entire deposit & debt obligations of approximately $179B for 2022. In 2022, $75B of the Bank’s deposit base was non-interest bearing.
Interest Expense WIll Rise Exponentially
Therefore, simplistically, if $100B of deposit base in 2023 requires 4% to stay put, the Bank’s interest expense, without considering its debt-related funding costs, will increase by $4B YoY. That is, if it can keep its deposits. We do not believe that FRC can. That compares to the reported interest income of $5.7B in 2022 when the Bank was in a growth mode and rapidly grew its loan book by $30B.
Loan Portfolio Pricing Stays Put
In either instance, the liquidity problem is further compounded by an asset-liability mismatch of immense proportions. The deposits will price upwards from an average cost below 89bps to around 4% by Q2-2023. However, only 20% of the loan portfolio will reprice upwards in 2023. That implies the entire balance sheet is upside down.
Loan Portfolio Concentrated – Low-Quality & Primarily Real Estate
Moreover, loans are concentrated primarily in real-estate lending, including rate-reset interest-only mortgages, commercial rentals and builder & construction loans. Ninety per cent of the loan book of $148B is dedicated to real estate, of which non-amortizing single-family loans are $51B, and multifamily loans are $11B. Thus, forty-three per cent of FRC’s book of loans is to a sector under intense pressure with The Fed, trying to control inflation. Moreover, as the rates rise, the economy slows, and additional stresses show up, single-family homes will see an increase in loan loss provisions. It is much easier to walk away from an interest-only mortgage, especially if the house is underwater, because no equity contribution was ever made, and none can be recovered.
Murphy’s Law in Action
To conclude, FRC is a living & currently breathing Murphy’s Law in action; Anything that can go wrong will go wrong, and at the worst possible time.
We recommend that at every sign of strength, FRC stockholders SELL.
And, if, like us, you are wondering why the banking consortium is supporting it, we suspect that it has something to do with February 2023 stock offering led by BofA Securities, J.P. Morgan, Goldman Sachs & Co. LLC and Morgan Stanley.
The rest of this report highlights some important disclosures from FRC’s 2022 10-K, with comments to assist our readers in understanding why we believe there is no hope for FRC. All statements and data are directly sourced from 10-K. The language from the 10-K filing has not been altered. Italicized portions are for emphasis.
In this section, all Data and Text are Sourced from 2022 10-K
The Loan Portfolio at FRC
- As of December 31, 2022, single family real estate secured loans represented $98.8 billion, or 59% of our total loan portfolio and had a weighted average LTV at origination of 59%. Our average loan commitment size was $1 million based on outstanding loans at December 31, 2022.
- HELOC – The majority of these lines are in a secured position behind a first mortgage originated by us or in a first-lien position. As of December 31, 2022, HELOCs were $2.8 billion, or 2% of our total loan portfolio. As of December 31, 2022, the average HELOC commitment size was $577,000, and the weighted average CLTV including the first residential mortgage, if any, at origination was 49%.
- As of December 31, 2022, single family construction loans were $1.2 billion, or 1% of our total loan portfolio. As of December 31, 2022, the average single family construction loan commitment size was $4 million.
- As of December 31, 2022, multifamily loans were $21.6 billion, or 13% of our total loan portfolio. As of December 31, 2022, the average multifamily mortgage loan commitment size was $3 million, and the weighted average LTV at origination was 52%.
- As of December 31, 2022, commercial real estate loans were $10.8 billion, or 6% of our loan portfolio. As of December 31, 2022, the average commercial real estate loan commitment size was $4 million, and the weighted average LTV at origination was 46%.
- As of December 31, 2022, multifamily/commercial construction loans were $2.1 billion, or 1% of our loan portfolio. As of December 31, 2022, the average multifamily/commercial construction loan commitment size was $8 million, and the weighted average LTV at origination was 54%.
- As of December 31, 2022, business loans and lines of credit were $18.8 billion, or 11% of total loans outstanding. Of this total, $12.3 billion was in the form of lines of credit. The utilization rate for these lines of credit was 33.4% at December 31, 2022.
- As of December 31, 2022, stock secured and other secured loans totaled $7.7 billion, or 5% of our loan portfolio. In addition, other loans include household debt refinance loans, which consist of term loans and personal lines of credit, which are unsecured loans made to refinance existing household debt and access additional financing at fixed interest rates. As of December 31, 2022, unsecured loans totaled $3.0 billion, or 2% of our loan portfolio.
The Bank’s Mortgage Portfolio is Primarily Non-Amortizing Interest Only Loans
Our loan portfolio is concentrated in single family residential mortgage loans, including non-conforming, adjustable-rate, initial interest-only period and jumbo mortgages.
Our single-family mortgage loans, represent over half of our total loan portfolio. Single family mortgage loans primarily consist of hybrid ARMs that will adjust within one to ten years in the future, as well as loans that are currently adjustable rate. Increases in prevailing market interest rates result in increased payments for borrowers who have ARMs, which may increase the possibility of defaults. In addition, a substantial portion of single-family mortgage loans have an initial interest-only period of generally ten years. When an interest-only loan converts to fully amortizing status, monthly payments are subject to change and may increase by a substantial amount. Even without an increase in prevailing market interest rates, borrowers may not be able to afford the increased monthly payments, which may result in higher loan delinquency levels. In addition, real estate values may decline, and credit standards may tighten in concert with the higher payment requirements, which may make it difficult for borrowers to sell their homes or refinance their loans to pay off their mortgage obligations. As a result, interest-only loans are considered to have an increased risk of delinquency, default and foreclosure compared to conforming loans and may result in higher levels of realized losses.
Given the significant and rapid increases in interest rates in 2022, we experienced rapid migration of deposits to higher yielding products and asset classes. A prolonged period of high or increasing interest rates may cause us to experience an acceleration of deposit migration, which could adversely affect our liquidity.
We have experienced net interest margin compression and expect to continue to experience compression while higher interest rates and inflationary pressures persist, which could have a material adverse effect on our financial results and condition.
Our loan portfolio primarily consists of adjustable-rate loans. Any rise in prevailing market interest rates has resulted and may continue to result in increased payments for some borrowers who have adjustable-rate loans, increasing the possibility of defaults. This could have an adverse effect on our business, results of operations or financial condition. In addition, demand for loans may continue to be impacted while interest rates remain high or increase further.
Deposits At FRC
Based on the most recent publicly available regulatory filings, as of December 31, 2022, we were the 12th largest Bank in the nation measured by total deposits. As of December 31, 2022, 40% of our total deposits came from the San Francisco Bay Area, 19% from New York, 9% from Boston, 8% from Los Angeles, 6% from wealth management sweep programs and 18% from other deposits (which consist of Preferred Banking and Preferred Banking Office deposits in other locations, as well as other deposits that are not attributable to any specific deposit location)
As of December 31, 2022, we held $100.1 billion of deposits associated with our Preferred Banking activities, $49.6 billion of deposits associated with our Preferred Banking Offices, $10.2 billion of wealth management deposits generated through our sweep programs, and $16.6 billion of other deposits. Preferred Banking is a substantial source of deposits. Preferred Banking deposits have grown at a CAGR of 20% in the last five years.
Brokered deposits, public deposits, third-party broker dealer sweeps, negotiable CDs, foreign-exchange and other deposits not attributable to any specific deposit location have also been a significant source of deposit growth during 2022.
We face competition with respect to our deposits. The inability to maintain or grow our deposits could force us to use more expensive and less stable sources of funding
Given the magnitude and pace of rising interest rates, competition with respect to deposit pricing has intensified. Our ability to offer competitive pricing on our deposit products is critical to retaining our deposit base. In 2022, we have needed to offer higher interest rates for deposits, as a result of which our interest expense has increased, and net interest margin compressed. If we need to offer higher interest rates to maintain current clients or attract new clients, our interest expense on deposits could continue to increase, perhaps materially, and there is no guarantee that we may be able to offer high enough interest rates to maintain current clients or attract new clients. An outflow of deposits because clients seek investments with higher yields or greater financial stability, prefer to do business with our competitors, or for other reasons could force us to rely more heavily on borrowings and other sources of funding to fund our business and meet withdrawal demands, adversely affecting our net interest margin. We may also be forced, as a result of any outflow of deposits, to rely more heavily on equity to fund our business, resulting in greater dilution of our existing shareholders.
For example, in 2022, due to rising interest rates, we continued to see a shift in deposit product mix to higher yielding instruments. We expect this trend will continue, and we may experience higher deposit outflows while high or rising interest rates continue to persist. The occurrence of any of these events could materially and adversely affect our business, results of operations or financial condition.
Total deposits were $176.4 billion at December 31, 2022, an increase of 13% compared to $156.3 billion at December 31, 2021. Deposits were our primary source of funding and represented 92% of our funding base at December 31, 2022. In the fourth quarter of 2022, average total checking deposit balances decreased 8% from the prior quarter and increased 18% in 2022.
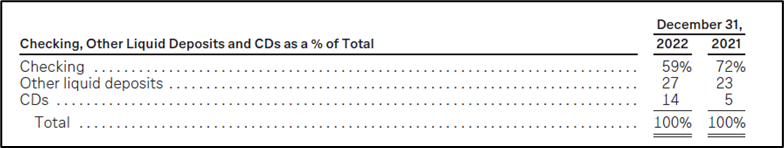
Source: 2022 10K, Page 78
The average interest rate paid on CDs was 2.69% for the fourth quarter of 2022, compared to 1.26% for the third quarter of 2022. The average interest rate paid on total checking deposits was 0.20% for the fourth quarter of 2022, compared to 0.09% for the third quarter of 2022. We expect this trend to continue while interest rates remain high or increase further.
ANTYA – The average broker deposit in Q4-22 cost 3.81%.
If we continue to grow and if we report $250 billion or more in total consolidated assets or $75 billion or more in weighted short-term wholesale funding, nonbank assets or off-balance sheet exposure, we would become subject to new and more stringent regulatory requirements relating to capital and liquidity
New and more stringent regulatory requirements will apply to us if we become a Category III banking institution by having $250 billion or more in total consolidated assets or $75 billion or more in weighted short-term wholesale funding, nonbank assets or off-balance sheet exposure based on a trailing four-quarter average. Among other things, we would be subject to enhanced capital and liquidity requirements including the LCR and NSFR rules. As a result, we would be required to increase our holdings of HQLA and/or change the composition of our funding, which could adversely affect our net interest income and net interest margin. Further, we would be subject to the SLR and CCyB, in addition to the capital conservation buffer, under the Basel III Capital Rules and Dodd-Frank Act capital stress testing requirements. Further, we may be subject to heightened supervisory expectations, which could result in additional regulatory scrutiny, higher penalties, and more severe consequences if we are unable to meet those expectations.
ANTYA – In 2022, FRC was at the edge of becoming big enough for The Fed to start taking a serious interest in the Bank.
Assets
Our total assets were $212.6 billion at December 31, 2022, and $181.1 billion at December 31, 2021, a 17% increase. Asset growth was driven primarily by growth in loans and investments, partially offset by a decrease in cash.
Our holdings of assets that are considered HQLA, including eligible cash, totaled $26.0 billion at December 31, 2022, compared to $30.4 billion at December 31, 2021.
ANTYA – This is insufficient with $72B of non-interest-bearing deposits in checking accounts.
Loans
At December 31, 2022, loans were $166.9 billion, an increase of 24% compared to $135.0 billion at December 31, 2021. Loans increased as a result of growth primarily in single family, multifamily, commercial real estate, stock secured and other business loans, partially offset by a decrease in capital call lines of credit
Our single-family mortgage loans, including HELOCs, were $101.5 billion and represented 61% of total loans at December 31, 2022, compared to $79.4 billion, or 59% of total loans at December 31, 2021.
ANTYA – Exposure to real estate loans increased by about $32B at the peak of the market.
Net Interest Income and Net Interest Margin
Net interest margin was 2.65% in 2022, compared to 2.67% in 2021 and 2.72% in 2020. The decrease in 2022 was primarily due to average funding costs increasing more rapidly than the offsetting increases in the average yields on interest-earning assets. We expect this trend to continue while interest rates remain high or increase further.
Average non-interest-bearing checking deposit balances, a significant source of our funding, increased 18% in 2022 and increased 58% in 2021.
The Loan Book – Real Estate Lender Masquerading as a Bank
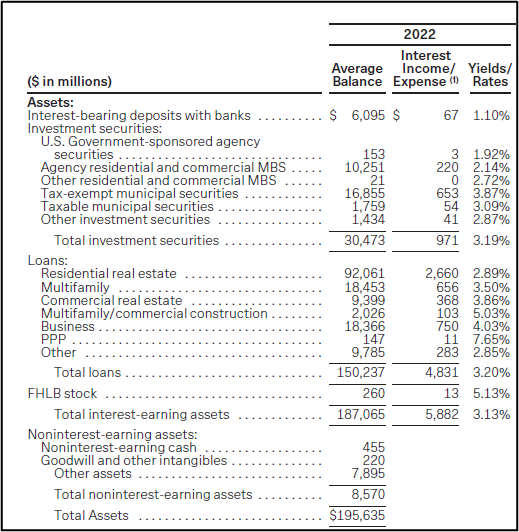
Source: 2022, 10K – Page 81
ANTYA – More than 50% of residential real estate loans are non-amortizing, interest-only for the first ten years. That is a low-quality loan book.
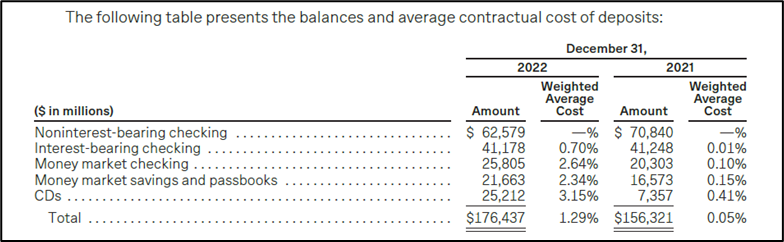
Non-Interest-Bearing Deposits Fund Non-Amortizing Adjustable Real Estate Mortgages
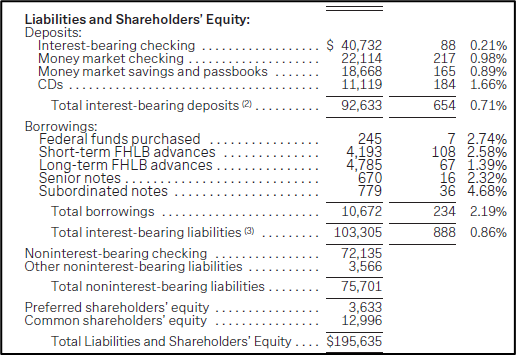
Source: 2022 10K – Page 81
Total interest expense consists of interest expense on deposits and borrowings. The increase in interest expense in 2022 was the result of an increase in the average cost of interest-bearing liabilities to 0.86% in 2022 from 0.31% in 2021 and an increase of 17% in average interest-bearing liabilities.
ANTYA – 43% of deposits had zero cost in 2022.
At December 31, 2022, our total deposits were $176.4 billion, compared to $156.3 billion at December 31, 2021, an increase of 13%, and the weighted average contractual rate paid on total deposits was 1.29% and 0.05% for 2022 and 2021, respectively.
Non-Interest Expense – Little Room to Decline
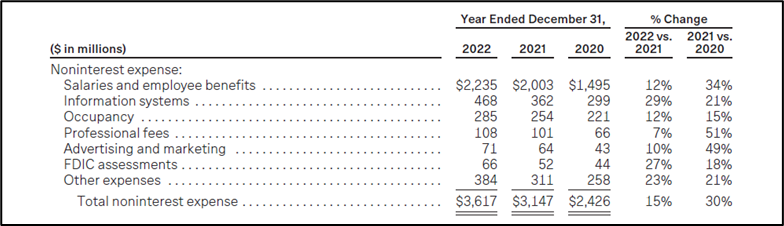
Source: 2022 10K – Page 90
Breakdown of Other Expenses – Too Little to Assist
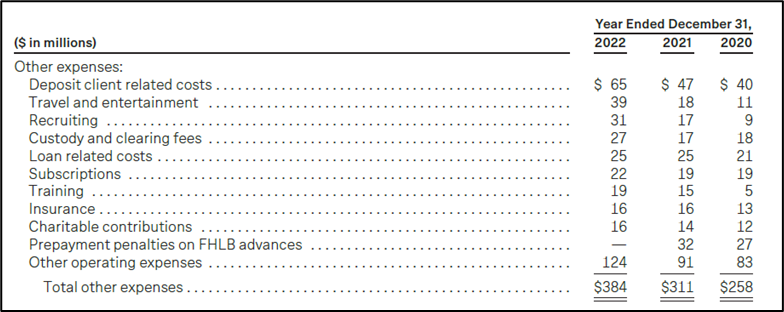
Source: 2022 10K – Page 92
Fixed vs. Adjustable Loans
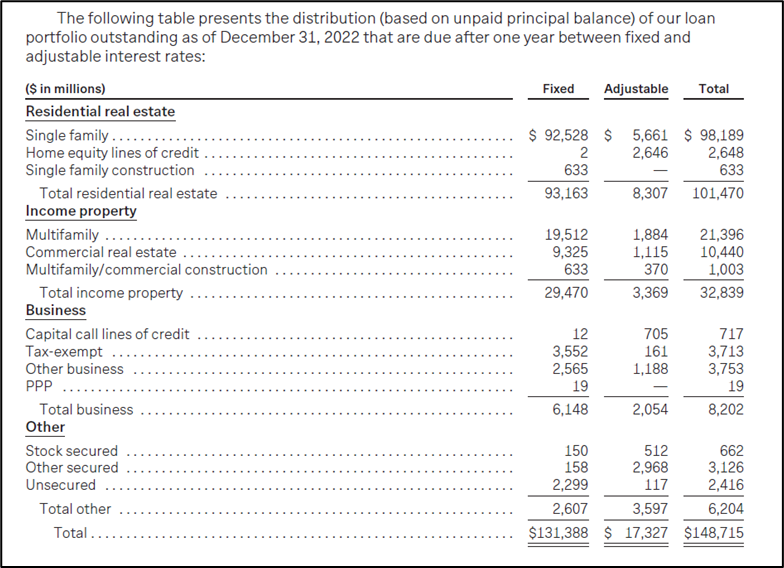
Source: 2022 10K – Page 103
Residential Real Estate Portfolio
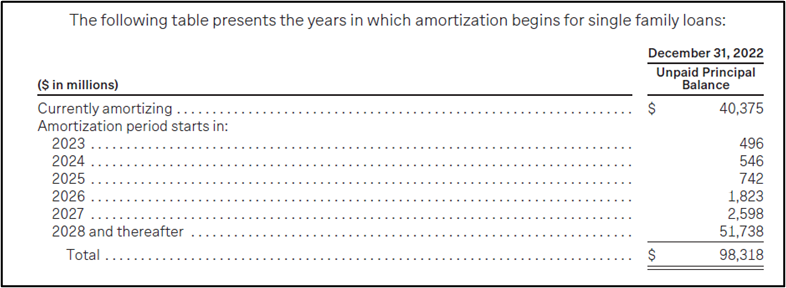
Source: 2022 10K – Page 106
Multifamily Loans
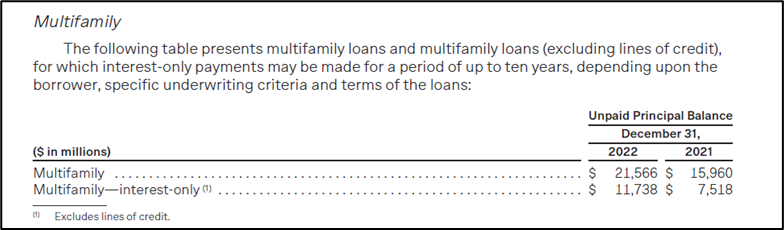
Source: 2022 10K – Page 108
Estimated uninsured deposits totaled $119.5 billion and $116.7 billion as of December 31, 2022, and 2021, respectively. Estimates of uninsured deposits are based on the methodologies and assumptions used in our Consolidated Reports of Condition and Income (“Call Report”) filings.
Source: 2022 10K – Page 119
Total deposits included $5.3 billion of brokered deposits at December 31, 2022, compared to $851 million at December 31, 2021. The weighted average contractual rate paid on brokered deposits was 3.81% and 0.02% at December 31, 2022, and 2021, respectively.
At December 31, 2022, the weighted average contractual rate paid on CDs was 3.15%, and the weighted average remaining maturity of CDs was 3.0 months. The contractual maturities and weighted average contractual rate of our CDs were as follows.
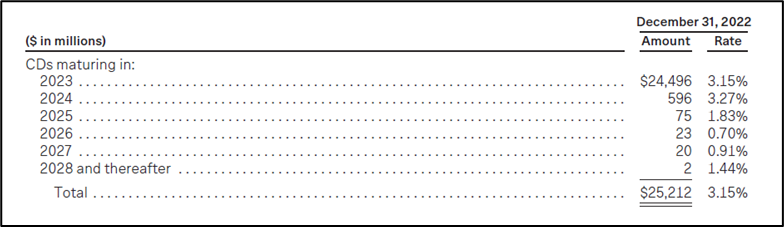
Source: 2022 10K – Page 121
CDs Repricing on April 1, 2023
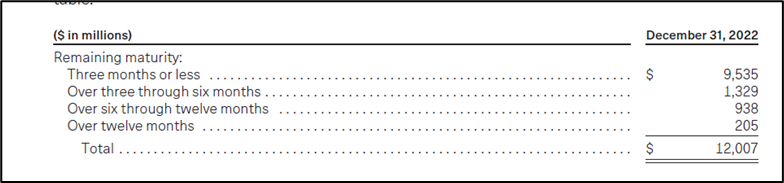
Source: 2022 10K – Page 121
Balance Sheet Overview – Significant Asset Liability Mismatch Exists
Our net interest income and net interest margin may be affected by the mix of interest-earning assets and interest-bearing liabilities. The Bank has earning assets with reset periods or maturity of less than one year totaling $40.5 billion, or 20% of total earning assets at December 31, 2022. Of these earning assets, the Bank has loans which are currently adjustable and reprice with indices or mature within one year totaling $35.1 billion, or 21% of the total loan portfolio at December 31, 2022. The loan portfolio that reprices at least quarterly to market rate indices, such as Prime or LIBOR, totaled $24.4 billion, or 15% of the total loan portfolio at December 31, 2022. The loan portfolio with lagging indices, such as the COFI Repl Index or CMT, totaled $6.7 billion, or 4% of the total loan portfolio at December 31, 2022.
At December 31, 2022, CDs that met or exceeded the FDIC insurance limit of $250,000 totaled $15.2 billion.

Source: 2022 10K – Page 180
Top Management Compensation For A Job Well Done
The total fair value of Performance RSUs that vested in 2022, 2021 and 2020 was $146 million, $184 million, and $100 million, respectively. The total fair value of Time RSUs that vested in 2022, 2021 and 2020 was $42 million, $37 million, and $18 million, respectively. No cash consideration was received in connection with the vesting of these awards.
The total fair value of PSUs that vested during 2022, 2021 and 2020 was $47 million, $46 million and $30 million, respectively. No cash consideration was received in connection with the vesting of these awards.
In February 2023, we offered and sold an aggregate of 2,875,000 new shares of common stock in an underwritten public offering. Net proceeds based on the public offering price, after underwriting discounts and estimated expenses, were $397 million.
Conclusion – Caveat Emptor
On Friday, we made a long Credit Suisse and short FRC bet. It is telling that within 24 hours, we have been proven wrong about Credit Suisse. A systemically important global financial institution, trading at an 80% discount to its credible book value, is being forced into a merger with UBS AG, nationalized, or both. Perhaps, there were issues known to regulators or others that were not evident in the financial statements filed with the SEC as recently as last week. The CEO and Chairman sign-off are dated March 2023. We could rapidly recover our losses, especially given that contingent convertible holders have taken a bath of $17B, and we will be getting UBS stock in exchange. We also believe UBS got the deal of a lifetime.
There are rumours that Warren Buffet and the U.S. government are in discussion regarding the banking industry. What comes of it, we do not know. Everything we can see and deduce from the financial statements tells us that FRC is done. We will stay away from it.