The U.S. Bureau of Labor Statistics (“BLS”) released its employment report on March 09, 2018. Equity markets were ecstatic either by the robust job creation data including revisions to prior numbers; both the Dow and S&P 500 were up by more than 1.7%, or by a lack of acceleration in the wage growth which came in at an annualised 2.6%. Whatever, the case might be, it is evident that the U.S. economy is creating jobs at a significant rate and that the pace of job creation has accelerated. We highlight seven data points that suggest a re-acceleration in wage growth is just around the corner, and that the next monetary policy committee meeting of the FOMC on March 20, 2018, is likely to release a more hawkish prospective guidance than currently anticipated.
We conclude that equity market narrative will change from “three rate hikes and maybe a fourth” to “definitely four rate hikes in 2018”.
The U.S. Labour Market is Much Stronger than Expected
BLS release outlined 313,000 jobs created for February 2018, which is the highest number of jobs added in the month of February in the last ten years. BLS also upwardly revised job creation data for January 2018, and December 2017 by 39,000 and 15,0000 additional jobs respectively. Figure 1 illustrates the trend.
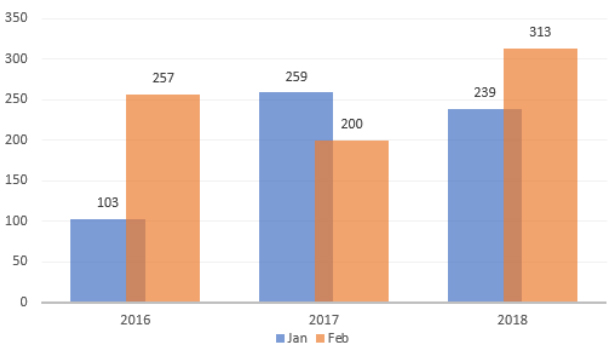
Figure 1: U.S. Monthly Employment Growth (In 000’s)
Source: BLS & ANTYA Investments Inc.
Revisions in the first two months of the year at 54,000 jobs, already approach 46.5% of the upward revisions of 118,000 jobs for all of 2017.
The U.S. Labour Market is Gaining Momentum
At this late stage in the economic cycle, one would expect job growth to slow down. However, that wisdom appears ill-conceived given that total jobs created for three months ended in February for each of 2016, 2017 and 2018 have been trending upwards at a time when the unemployment rate is approaching historically low levels. Figure 2 shows the momentum in U.S. employment generation.
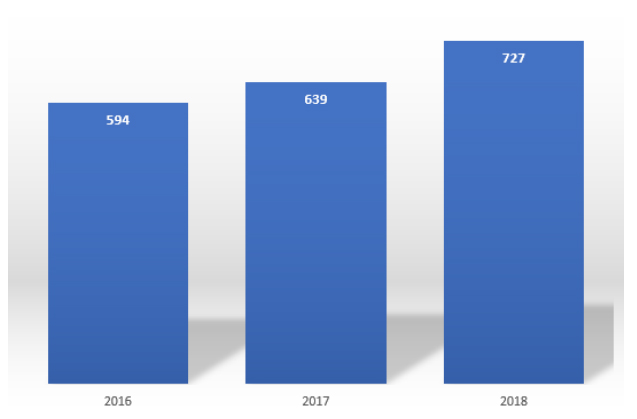
Figure 2: December – February Job Additions in Each Year (In 000’s)
Source: BLS and ANTYA Investments Inc.
Labour Force Participation Rate is Up
Those with dovish views regarding FOMC’s intentions have invariably pointed to a low LFPR. However, recently in its monetary policy report to Congress, the FOMC highlighted the secular, rather than cyclical characteristics of the decline in the LFPR, which we discussed in our report of March 05, 2018, Eight Hikes – 4 in 2018, and 4 in 2019 – What Does that Do to Asian Equity Markets?. The month on month LFPR increased .3%, implying an approximate addition of 800,000 individuals into the workforce. However, the unemployment rate held steady at 4.1%, which provides additional support to our hawkish opinion. Furthermore, we believe that an increase in LFPR is partially responsible for capping wage gains at an annualised rate of 2.6%.
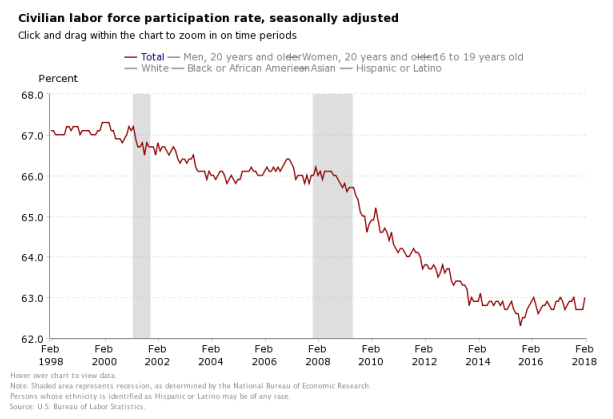
Figure 3: LFPR is Making A Comeback
Employment Gains are Widespread
An important indicator of the health of the overall economy and the job market is that skilled, semi-skilled and unskilled employees, all are in demand. As illustrated in Figure 4, the year-on-year unemployment rate for all education levels is lower, with a marked decline for those with less than high-school education as illustrated in Figure 4. In our opinion, with prospectively fewer hires available from this pool of labour, service sector wage inflation will show an accelerating trend going forward.
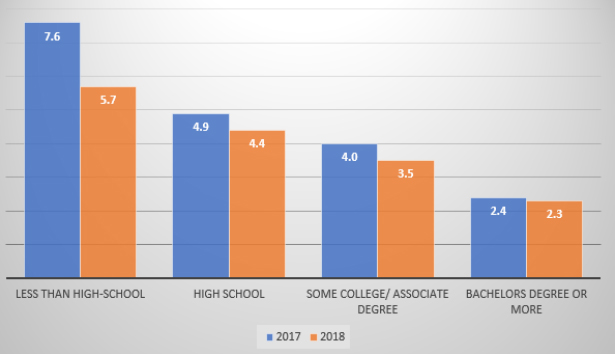
Figure 4: A Rising Tide Lifts All Boats (Unemployment %)
Source: BLS and ANTYA Investments Inc.
Duration of Unemployment Has Declined
The total number of unemployed persons over 27 weeks, considered long-term unemployment, has declined 21% year-on-year from 1.76 million in 2017 to 1.39 million in 2018. Furthermore, with the job market becoming healthier, total duration, mean duration and median duration of unemployment has declined by 11.9%, 8.8% and 7.9% respectively as outlined in Figure 5.
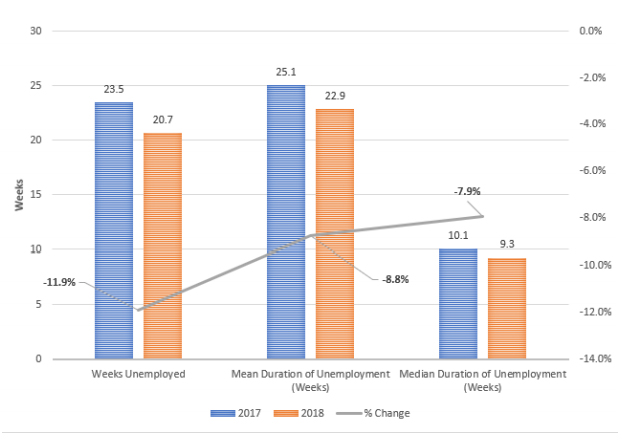
Figure 5: The Overall Job Market is Healthier
Source: BLS and ANTYA Investments Inc.
Fewer Discouraged Workers Available
In February 2017, discouraged workers – defined as persons outside the labour force who want a job, including those who are not currently looking because they believe no jobs are available – amounted to 522,000. For February 2018, that number declined 28.5% to 373,000 on a seasonally unadjusted basis. Figure 6 presents the data.
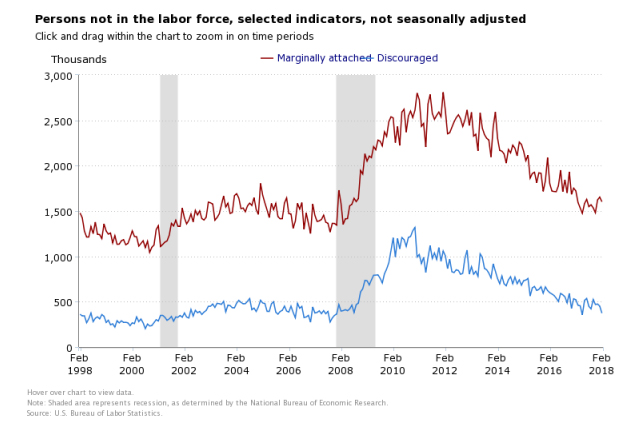
Figure 6: Discouraged Workers Coming Back Keeps a Lid on Wage Cost Inflation
Manufacturing Wages Up, Services Lag
In our estimate, to the extent the stock market rally on March 09, 2018, was driven by the belief that wage inflation is under control, some of those gains will evaporate as capital market participants digest divergent trends underway in the labour market over the coming weeks. On a seasonally adjusted basis, wages in the manufacturing sector grew 3.8%, compared to 2.9% in the services sector.
We Conclude Wage Inflation is Headed Higher
Of the 103.6 million production and non-supervisory employees on nonfarm payrolls, 88.8 million or 85.7% are employed in the services sector as of February 2018. Manufacturing makes up the rest. In the preceding twelve months, 171,000 manufacturing jobs have been created while 1.418 million services sector jobs have come into existence. With the Trump administration working overtime to bring back manufacturing jobs to the U.S. mainland with its various policy initiatives and Institute of Supply Management already highlighting labour-related challenges in its multiple surveys, manufacturing wages will continue to move up at a similar rate.
The services sector, on the other hand, has benefitted both from an improving LFPR and a significant decline in unemployment of individuals with no high-school diplomas and high-school diplomas as illustrated in Figure 4. With those categories of employees now unavailable widely and quickly and the duration of unemployment declining concomitantly with an improving trend of job openings per unemployed person, ANTYA is of the view that wage inflation is around the corner. We expect wage inflation to breach the 3% level in the second half of 2018.
Given FOMC’s data-dependent and backwards-looking view of the world, these new data points are bound to bring more hawkish opinions, and we expect the dot plot to trend higher. We believe 4 hikes in 2018, and another 4 in 2019, are on the table. Draghi and Kuroda are dovish, Carney and Powell appear to be backing firmer rates, while Poloz is caught in a bind. Nonetheless, higher U.S. yields will mean a stronger U.S. dollar.
For investors in the U.S., ANTYA recommends an overweight position in financials, technology and other growth stocks. Value stocks, utilities and defensive names will continue to lag the market.
ANTYA is overweight growth and underweight value and yield.