In our first issue, we discuss the contribution of asset allocation to portfolio performance and highlight that in the long-term, a portfolio comprising a judiciously chosen set of assets is more valuable, than actual stocks or bonds underlying those asset classes.
ANTYA, founded by Neeraj Monga, offers institutional grade investment management services to Canadians in Alberta, British Columbia and Ontario. Our Vision is to provide “Investing That Empowers You”, and our Mission is “Simplicity and Transparency” in everything we do.
I am often asked, what is the meaning of ANTYA, and what does it stand for? Investors are well aware of Google, which has become the de-facto repository of global information. Google is a play on “Googol” which is a very large number beginning with 1 followed by 100 zeros. Similarly, ancient Indian mathematicians had specific names for very large numbers, and named numbers all the way to 10147. ANTYA represents the number 1015, or 1,000 Trillion.
ANTYA intends to secure the financial future of Canadians by keeping investment management costs low, while offering well-diversified portfolios suited to meeting either current income or longer-term savings needs. When we pick stocks we will strive to avoid the corporate governance and accounting related blow-ups that torpedo portfolio performance. ANTYA’s proprietary Astute Asset Allocation algorithm, backs our AAA promise to clients.
ASSET ALLOCATION HOLDS FORT
In our first issue, we discuss the contribution of asset allocation to portfolio performance and highlight that in the long-term, a portfolio comprising a judiciously chosen set of assets is more valuable, than actual stocks or bonds underlying those asset classes. Such a portfolio will minimise investment management & trading costs, thereby benefitting investors immensely. Academics, industry practitioners and analysts have done extensive work on the contribution of asset selection/allocation to portfolio performance. In a seminal study titled Determinants of Portfolio Performance5 the authors (“BHB”) suggested that designing a portfolio involves at least four steps;
- deciding which asset classes to include and which to exclude from the portfolio;
- deciding upon the long-term weights for each of the asset classes comprising the portfolio;
- strategically altering the investment mix weights away from normal in an attempt to capture excess returns from short-term fluctuations in asset class prices (market-timing); and
- selecting individual securities within an asset class to achieve superior returns relative to that asset class (security selection).
For the general investor the four steps can be explained as follows. First decide the composition of the portfolio. That means decide the proportion of the portfolio that will be invested in equities, bonds, real estate, and/or art etc. among other things. Second, once investors have decided upon the underlying asset classes of the portfolio, then the long-term asset allocation mix should be decided. For instance, the standard practice in a 60/40 portfolio of publicly traded assets is to allocate 60% to equities and the rest to bonds.
If an opportunity exists in the marketplace due to asset prices deviating from intrinsic values, then the third task is to decide the tactical tilt of asset allocation away form the policy mix. For instance, the significant decline in equity markets in 2009, or the current decline in the prices of Oil and Gold, could be taken as a sign by some managers to tactically adjust allocation to Oil and/or Gold away from the longer-term policy mix.
Finally, the 4th tenet of the plan involves picking stocks or bonds individually to outperform the asset class benchmark. That involves making active bets on stocks or bonds, sucfh as the active bet by Pershing Square Capital to increase its stake in Valeant Pharmaceuticals Inc. – in news for various reasons – in the hope that it will do better than the market. This is called active management, which is the quest of generating alpha i.e. beating the benchmark.
ACTIVE MANAGEMENT UNDERPERFORMS
Nonetheless, there is a significant body of literature that provides irrefutable evidence that active management does not generate excess returns after fees. Some of the most cited research is published by S&P Dow Jones Indices Versus Active Funds (SPIVA), which is a division of McGraw Hill Financial.
Source: SPIVA Reports and ANTYA Investments Inc
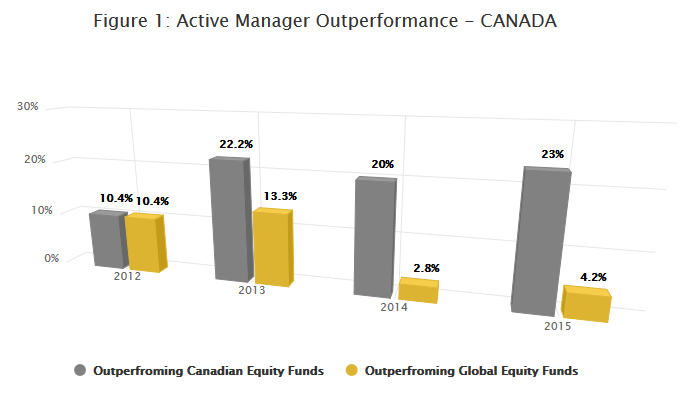
Figure 1 outlines that over a period of 5 years ended 2014, only 20% of the mutual fund managers guiding Canadian Equity funds (40 in the sample) outperformed the benchmark S&P/TSX Composite Total Return Index. Managers directing Global Equity funds (106 funds in the sample) faced acute challenges with merely 2.8% outperforming the respective benchmarks. Similar results are evident for 2012, 2013 and for the first half of 2015 as well. Data to the end of 2015 are not available yet. It should be no surprise that underperforming funds don’t survive.
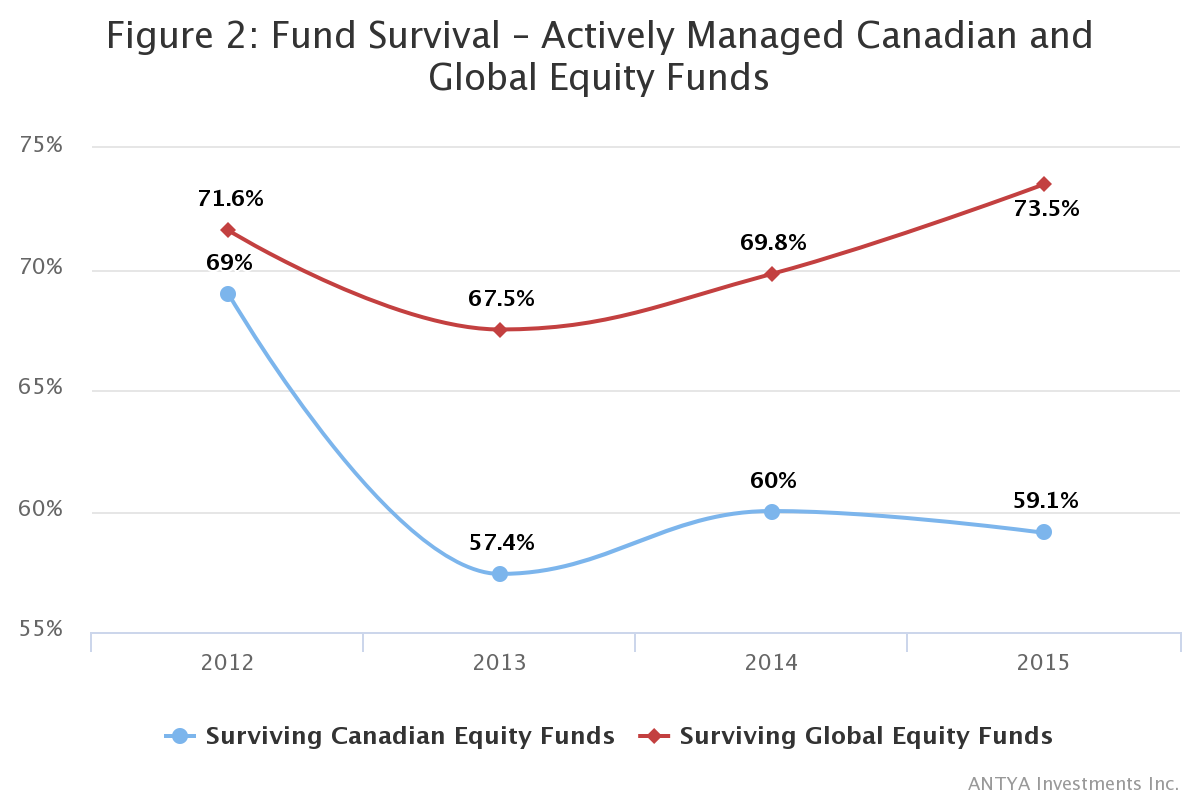
Figure 2, illustrates the survivorship rates for mutual funds in Canada.
Source: SPIVA Reports and ANTYA Investments Inc
As illustrated in Figure 2, for the 5 year period ended 2014, 40% of Canadian Equity funds did not make the cut, and were shut down or merged with other funds. Similarly 30% of Global Equity Funds were also shuttered. Furthermore, with increasing competition more funds are being closed than ever before. Thus fund performance data related to individual funds or fund complexes, as advertised in the marketplace, could be a biased indicator of actual performance. So how should Canadians view this data?
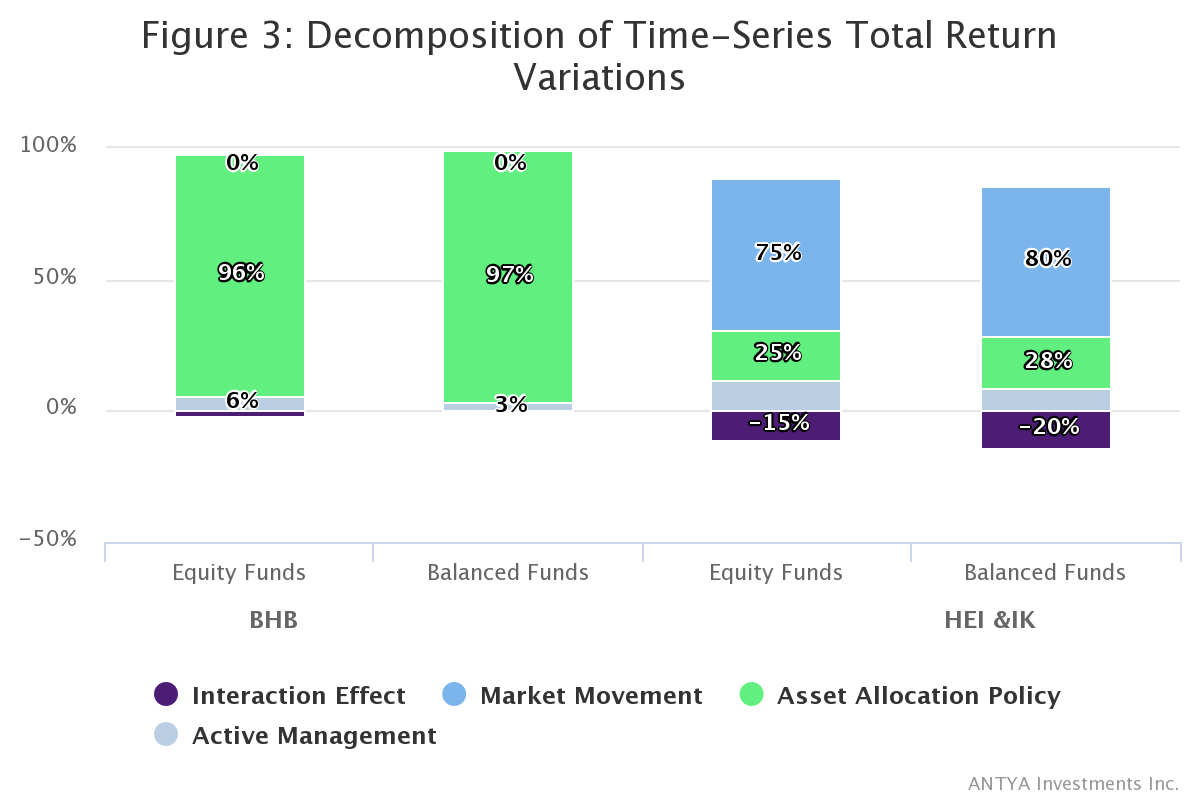
ANTYA suggests digging deeper, and decomposing reported returns into an asset allocation effect and the market movement/return effect. While BHB highlighted that 93.6% of an average fund’s return variance over time could be explained by asset policy mix decision (thereby leading to a series of enquiries into fund performance attribution and persistence of that performance), they overlooked the contribution of aggregate market movement in their analysis, or at least they did not report it. In 1991 Hensel and Ezra, and subsequently Ibbotson and Kaplan in 2000, pointed out that most of the variation in a typical fund’s return comes from market movement as highlighted in Figure 3.
Source: ANTYA Investments Inc. – Adaptation
In general, about three-quarters of a typical fund’s variation in time series return comes from general market movement, with the remaining portion split roughly evenly between the specific asset allocation and active management decisions.
LESSONS FOR INVESTORS
Given that in Figure 1 we outlined active managers struggle to beat the index with regularity, and Figure 3, highlights that market movement and asset allocation determine approximately 90% of the return, we propose that ensuring asset allocation mix is optimum, and suited to investors’ risk appetite and goals is very important. Moreover, if 90% of fund returns move with market returns & asset allocation, then in our view minimising investment management costs becomes a critical determiant of long-term returns.
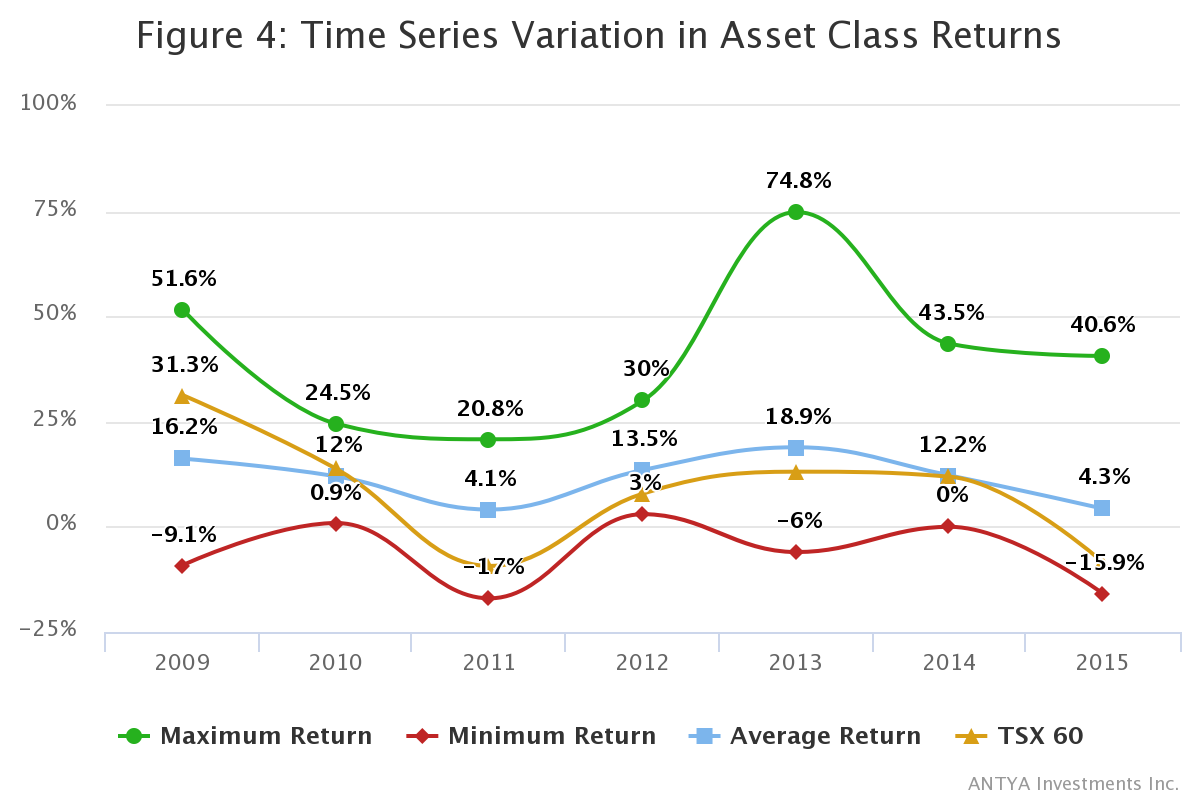
One should not forget that Canadian investors have an additional burden to bear. Given the concentartion of commodities and financial services in the TSX Composite index, choosing which asset class to invest in, and in what proportion becomes very important. Figure 4 highlights the performance of the TSX 60 total return index,compared to other asset classess that ANTYA tracks.
As highlighted in Figure 4, apart from 2009 when it hit a home run coming our of the recession of 2008, in general the TSX 60 underperformed all 15 asset classes in ANTYA’s database beginning 2009, from which our investor portfolios are constructed.
Source: ANTYA Investments Inc. All returns are hedged C$ returns.
For 2010, TSX 60 performed marginally better than the average of all asset classes whereas in each of 2011,2012,2013,2014 and 2015 the TSX60 total return index has performed worse than the average performance of all 15 asset classess in our database.
Thus ANTYA advises Canadian investors to branch out of Canada to benefit from the wide pool of asset diversification possibilities available south of the border. All portfolios created by ANTYA provide global asset diversification to all clients at minimal costs.
MINIMISE YOUR COSTS
Which brings us to the enormous burden currently borne by Canadian savers and highlighted in Figure 5.
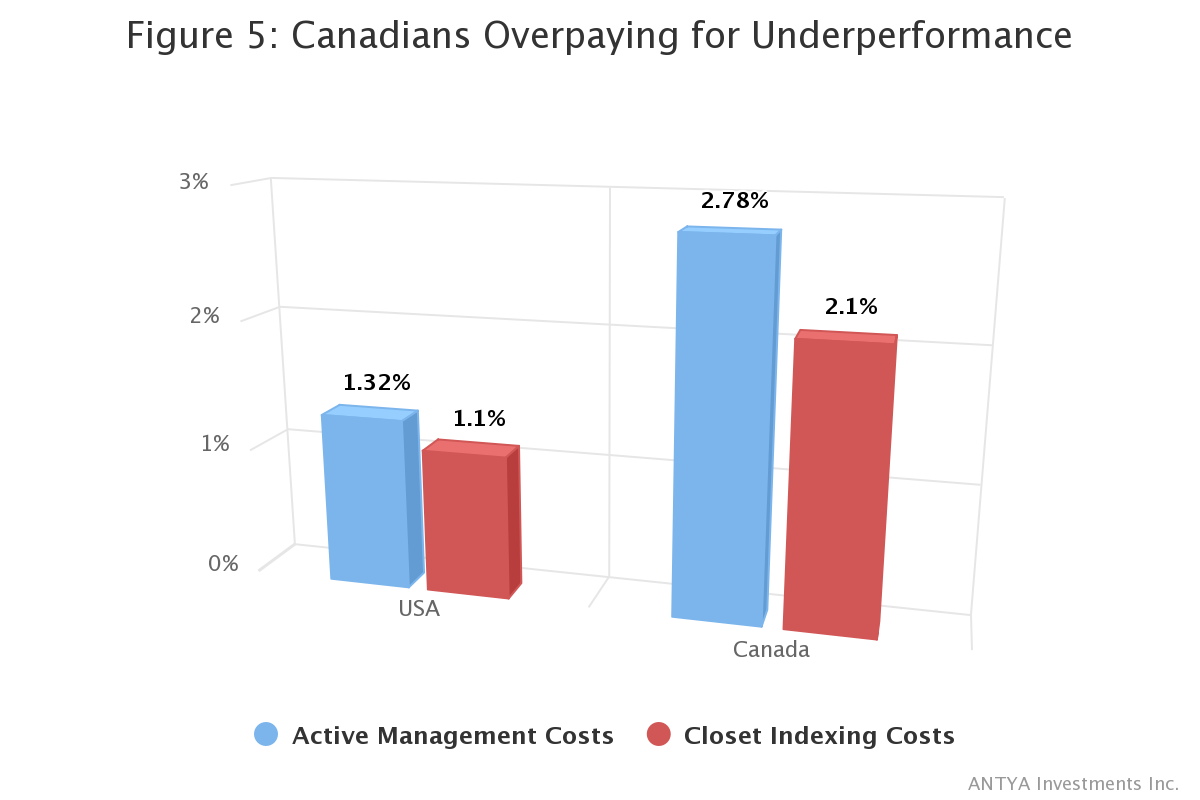
Source: Indexing and Active Fund Management: International Evidence – January 2015. IFIC disputes some of these findings, and has published studies outlining that Canadian cost disclosures are not comparable to U.S. costs. IFIC’s views are based on calculation differences surrounding Total Shareholder Costs of owning mutual funds in Canada and the U.S.
A study conducted by four university professors from the EU and the U.S. comparing active fund management practices across countries, uncovered that active management costs in Canada were twice those in the U.S. Moreover, the professors found evidence that 40% of Canadian active managers were hugging the index, while charging exorbitant active management fees, compared to 20% of the managers that were following a similar strategy in the U.S. Closet indexers pricing in Canada was 1.90 x that in the U.S., while for truly active managers the prices in Canada were 2.10 x U.S. prices.
CONCLUSION – LOWER FEES EMPOWER YOU
The various data points highlighted in this report belabor the point that Canadians savers are bearing the significant burden of very high investment management costs, poor diversification amongst asset classes, and under-performing asset managers. Clearly no investment manager can guarantee returns and therefore, investors are better served subscribing to asset allocation services that minimise costs.
ANTYA advises that investors forego the search for the mythical Alpha, and instead focus on the guaranteed dollar saved by lowering investment management fees, and costs associated with active trading. ANTYA believes in Simplicity & Transparency. So should you.
Click on the link below to download this report in PDF